Help Center帮助中心 Sharing, AI and data分享、AI 和数据
Browser extension浏览器插件
Last updated更新于 2026-10-15
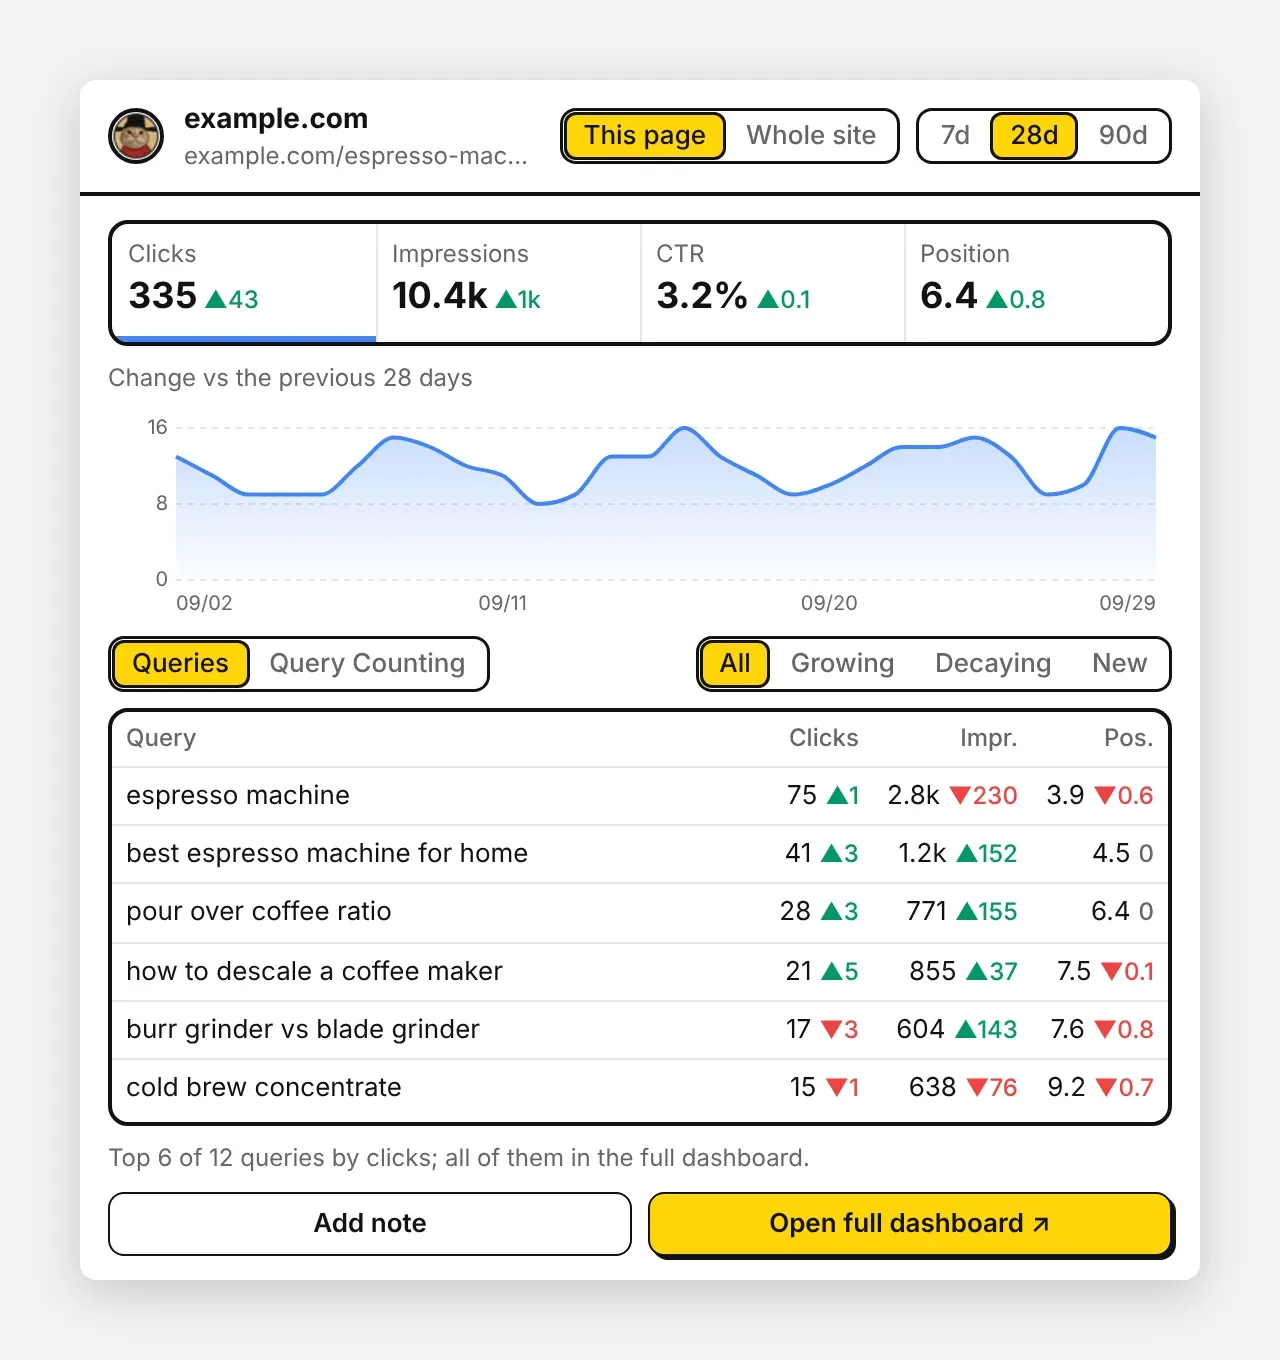
GSC Analytics, the Fuck SEO browser extension, shows Search Console data for the web page you’re on. Click its icon on any page of your site and a small window opens with that page’s clicks, impressions, CTR, position and queries, or the same numbers for the whole site. You can also add a change note or open the page in Fuck SEO.
Install
Install it from the Chrome Web Store. Chrome puts new extensions under the puzzle icon in the toolbar; pin it there to keep the icon in view. The Browser Extension card in Fuck SEO’s Settings links there too.
The extension uses your Fuck SEO login, so sign in at fuckseo.io in the same browser first. It shows data for the Google account currently signed in to Fuck SEO; to use another account, switch accounts in Fuck SEO.
Which page and site
When you click the icon, the extension reads the address of the current tab and the canonical link the page declares. It uses the canonical URL when it belongs to one of your Search Console properties, because Search Console records data under the canonical URL; otherwise it uses the tab’s address. The property is the longest URL-prefix property that contains the URL, or else the domain property that covers its host.
The window shows a message instead of data when:
- you aren’t signed in to Fuck SEO, with a Sign in button;
- no property in your account contains the URL;
- the tab isn’t a web page, such as a new tab or the browser’s settings.
Page or whole site, and dates
Switch between This page and Whole site, and pick 7d, 28d or 90d (28 days at first). The extension remembers the range you picked. Dates end on the latest day with final data, as in the app, and the data is for web search. See Data and limits for how the days and totals are worked out.
Numbers and chart
Clicks, Impressions, CTR and Position are totals for the range. Next to each is the change against the previous period of the same length: green ▲ is better and red ▼ worse; for position, lower is better. Click a number to chart that metric by day below it, and hover over the chart to see a day’s value. Everything fits in the window without scrolling.
If the page has no data in the range, a note above the chart explains that Search Console records data under the URL Google chose as canonical, so a page whose canonical is a different URL shows 0 here.
Queries
Queries lists, for this page, the 100 queries with the most impressions; for the whole site, the 500 with the most clicks. Rows are sorted by clicks and show Clicks, Impr. and Pos. with their change against the previous period. The window shows as many of the top rows as fit, and the line under the table gives the total; Open full dashboard shows them all.
When there is a previous period, you can filter the list by clicks: Growing (more than before), Decaying (fewer) and New (clicks now, none before).
Query Counting
Query Counting is loaded only when you open it. For 1-3, 4-10, 11-20 and 21+, it shows how many different queries were in that position range on at least one day of the period, with the percentage change against the previous period (”—” when the previous count is 0). The chart below stacks the four ranges by day, with 21+ at the bottom and 1-3 on top; hover over it to see a day’s counts. In This page, only this page’s queries are counted.
Add a note
Add note opens a form with Date (today by default, and it can’t be in the future), Title, Description and Applies to: This page or All Pages. Saved notes appear in Change notes in Fuck SEO. If a note can’t be saved, the form shows why, with a link to add it in Fuck SEO instead.
Open full dashboard
Open full dashboard opens Fuck SEO in a new tab. From This page it opens the site with this page’s detail panel; from Whole site, the site’s dashboard.
Language and appearance
The window uses the interface language set in Fuck SEO’s Settings, or your browser’s language if none is set. It follows your system’s light or dark mode.
Your data
The extension reads the page’s address and canonical link only when you click its icon, and sends them only to fuckseo.io, using your Fuck SEO login. Search Console data is read live, the same way as in the app. The extension stores the date range you picked. It also keeps the data it has loaded (your site list, language and the numbers it showed) in the browser’s memory for an hour, so reopening a page you’ve just looked at shows it straight away; within that hour the numbers aren’t reloaded. This data is kept apart for each account and deleted when you close the browser, or the next time you open the extension after signing out. See the Privacy Policy.
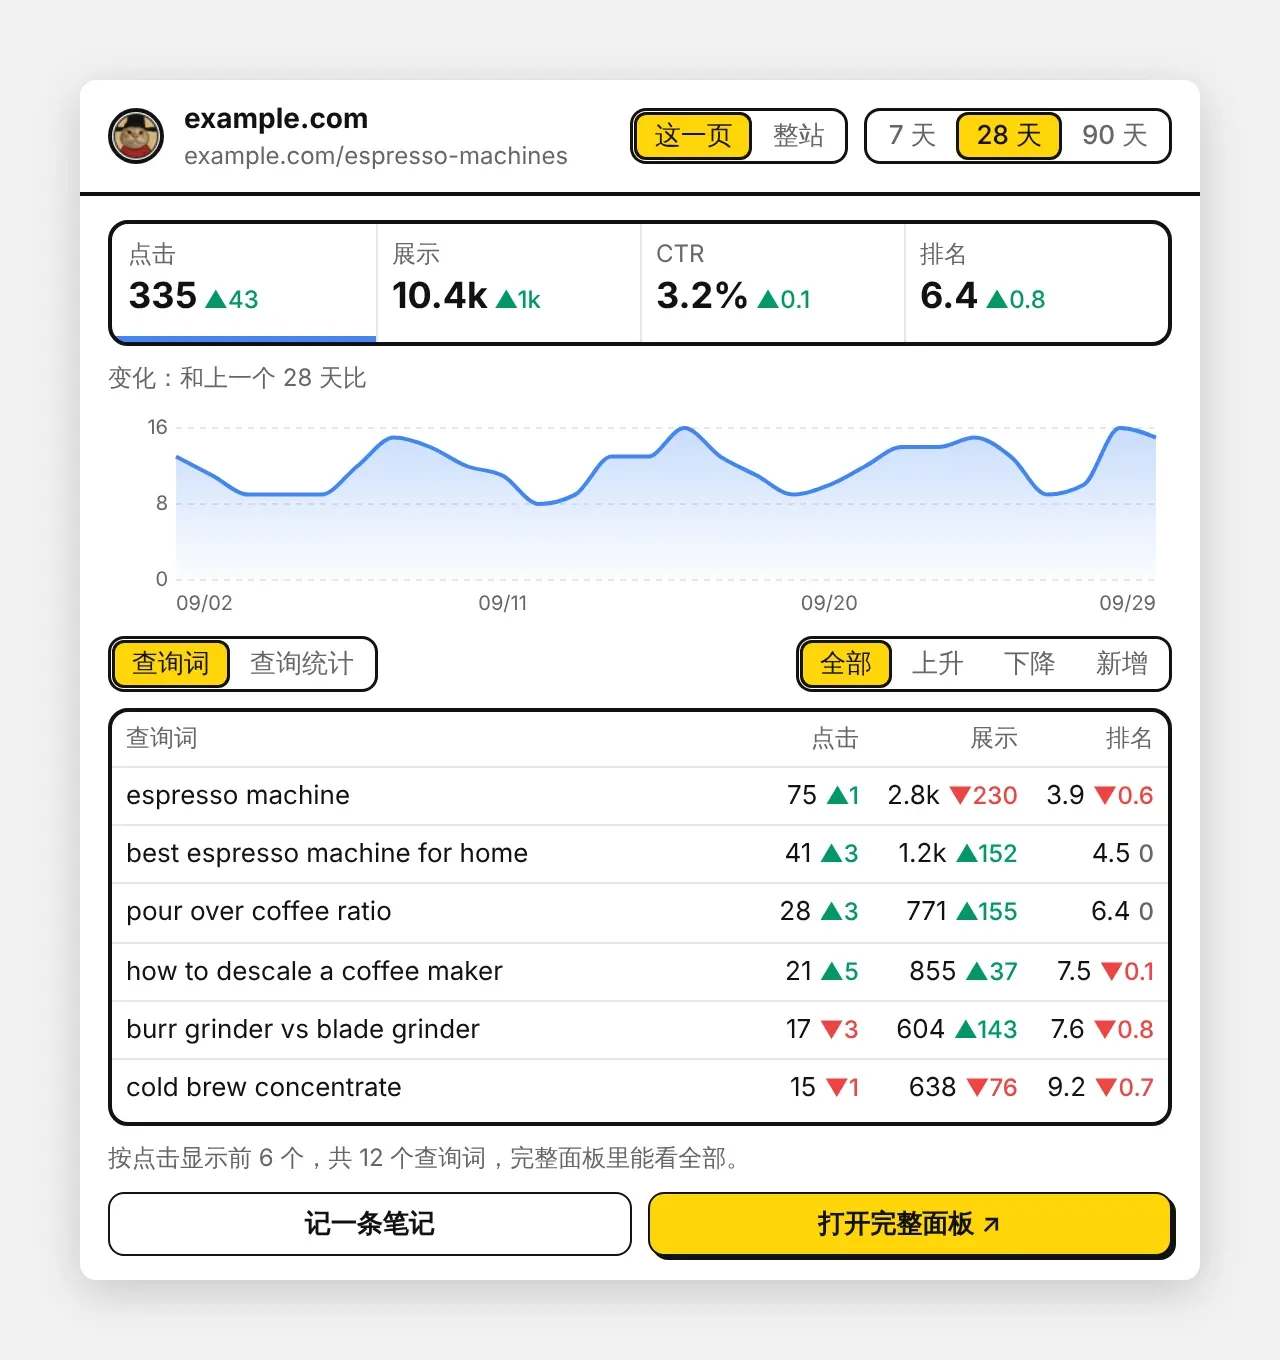
Fuck SEO 的浏览器插件叫 GSC Analytics,用来查看你正在浏览的网页在 Search Console 里的数据。在自己网站的任意页面上点插件图标,会弹出一个小窗,显示这一页的点击、展示、CTR、排名和查询词,也可以切换成整站的数字。还可以记一条变更笔记,或者在 Fuck SEO 里打开这一页。
安装
到 Chrome 网上应用店 安装。Chrome 会把新装的插件收在工具栏的拼图图标里,在那里把它固定,图标就会一直显示在工具栏上。Fuck SEO 系统设置 里的 浏览器插件 卡片也有安装链接。
插件用的是 Fuck SEO 的登录状态,所以先在同一个浏览器里登录 fuckseo.io。它显示的是 Fuck SEO 当前登录的 Google 账号的数据;要看另一个账号,在 Fuck SEO 里切换账号。
对应哪一页、哪个站点
点图标时,插件读取当前标签页的网址和网页声明的规范网址(canonical)。规范网址属于你的某个 Search Console 资源时用规范网址,因为 Search Console 按规范网址记数据;否则用标签页的网址。站点取包含这个网址的最长的网址前缀资源,没有的话取覆盖这个域名的网域资源。
以下情况小窗只显示一行提示,不显示数据:
- 没有登录 Fuck SEO,会显示 登录 按钮;
- 当前账号里没有包含这个网址的资源;
- 当前标签页不是网页,比如新标签页或浏览器设置页。
这一页或整站,日期
可以切换 这一页 和 整站,日期选 7 天、28 天 或 90 天(默认 28 天),插件会记住你选的天数。日期和网页版一样,截止到有最终数据的最新一天,数据是网页搜索的。日期和合计怎么算见 数据说明。
数字和曲线
点击、展示、CTR 和 排名 是这段时间的合计,旁边是和上一个同样天数的周期比的变化:绿色 ▲ 表示变好,红色 ▼ 表示变差;排名数字越小越好。点哪个数字,下面的曲线就按天画哪个指标,鼠标移到曲线上可以看到那一天的数字。所有内容在小窗里一屏放下,不用上下滚动。
这段时间里这一页没有数据时,曲线上方会说明:Search Console 按 Google 选定的规范网址记数据,规范网址不是这个网址时,这里会是 0。
查询词
查询词 列出这一页展示量最多的 100 个查询词;整站则是点击最多的 500 个。按点击从高到低排,每行显示 点击、展示 和 排名,以及和上一周期比的变化。小窗里放得下几行就显示前几行,表格下面写着一共有多少个,打开完整面板 能看到全部。
有上一周期时,可以按点击筛选:上升(比之前多)、下降(比之前少)和 新增(之前没有点击,现在有)。
查询统计
点开 查询统计 时才会加载。1-3、4-10、11-20 和 21+ 各显示这段时间里至少有一天排在这个区间的不同查询词有多少个,以及和上一周期比的百分比变化(上一周期为 0 时显示 ”—”)。下面的曲线图按天把四段叠在一起,21+ 在最下面、1-3 在最上面,鼠标移上去可以看到那一天各段的个数。在 这一页 下只统计这一页的查询词。
记一条笔记
点 记一条笔记 会打开表单:日期(默认今天,不能选以后的日子)、标题、描述 和 适用于(这一页 或 所有页面)。保存后的笔记会出现在 Fuck SEO 的 变更笔记 里。保存不成功时,表单会显示原因,并给一个去 Fuck SEO 里记的链接。
打开完整面板
打开完整面板 会新开一个标签页,打开 Fuck SEO。在 这一页 下打开这个站点和这一页的详情面板;在 整站 下打开这个站点的仪表盘。
语言和外观
小窗的语言跟随 Fuck SEO 系统设置 里选的界面语言,没选过的话跟随浏览器语言。浅色或深色跟随系统。
你的数据
插件只在你点图标时读取这一页的网址和规范网址,只发给 fuckseo.io,用的是你在 Fuck SEO 的登录状态。Search Console 数据和网页版一样实时读取。插件会保存你选的日期范围,并把读到的数据(站点列表、界面语言和显示过的数字)在浏览器内存里存 1 小时,1 小时内再打开看过的页面会直接显示,不重新读取。这些数据按账号分开,关掉浏览器就会删掉,退出 Fuck SEO 登录后下次打开插件时也会删掉。详见 隐私政策。