Help Center帮助中心 Dashboard仪表盘
Dashboard仪表盘
Last updated更新于 2026-10-09
The Dashboard is the first page you see when you open a site: totals and a daily chart for the dates you pick, compared with an earlier period, how many queries rank in each position range, and tables of queries, pages, countries and devices.
The top bar
Click the site switcher on the left, or press ⌘K / Ctrl K, and type part of an address to switch; you stay on the same page and filters are cleared. On the right are Share (see Sharing), Presets and Filter (see Filters and presets) and the date menu. The date range and search type stay selected as you move between the site’s pages.
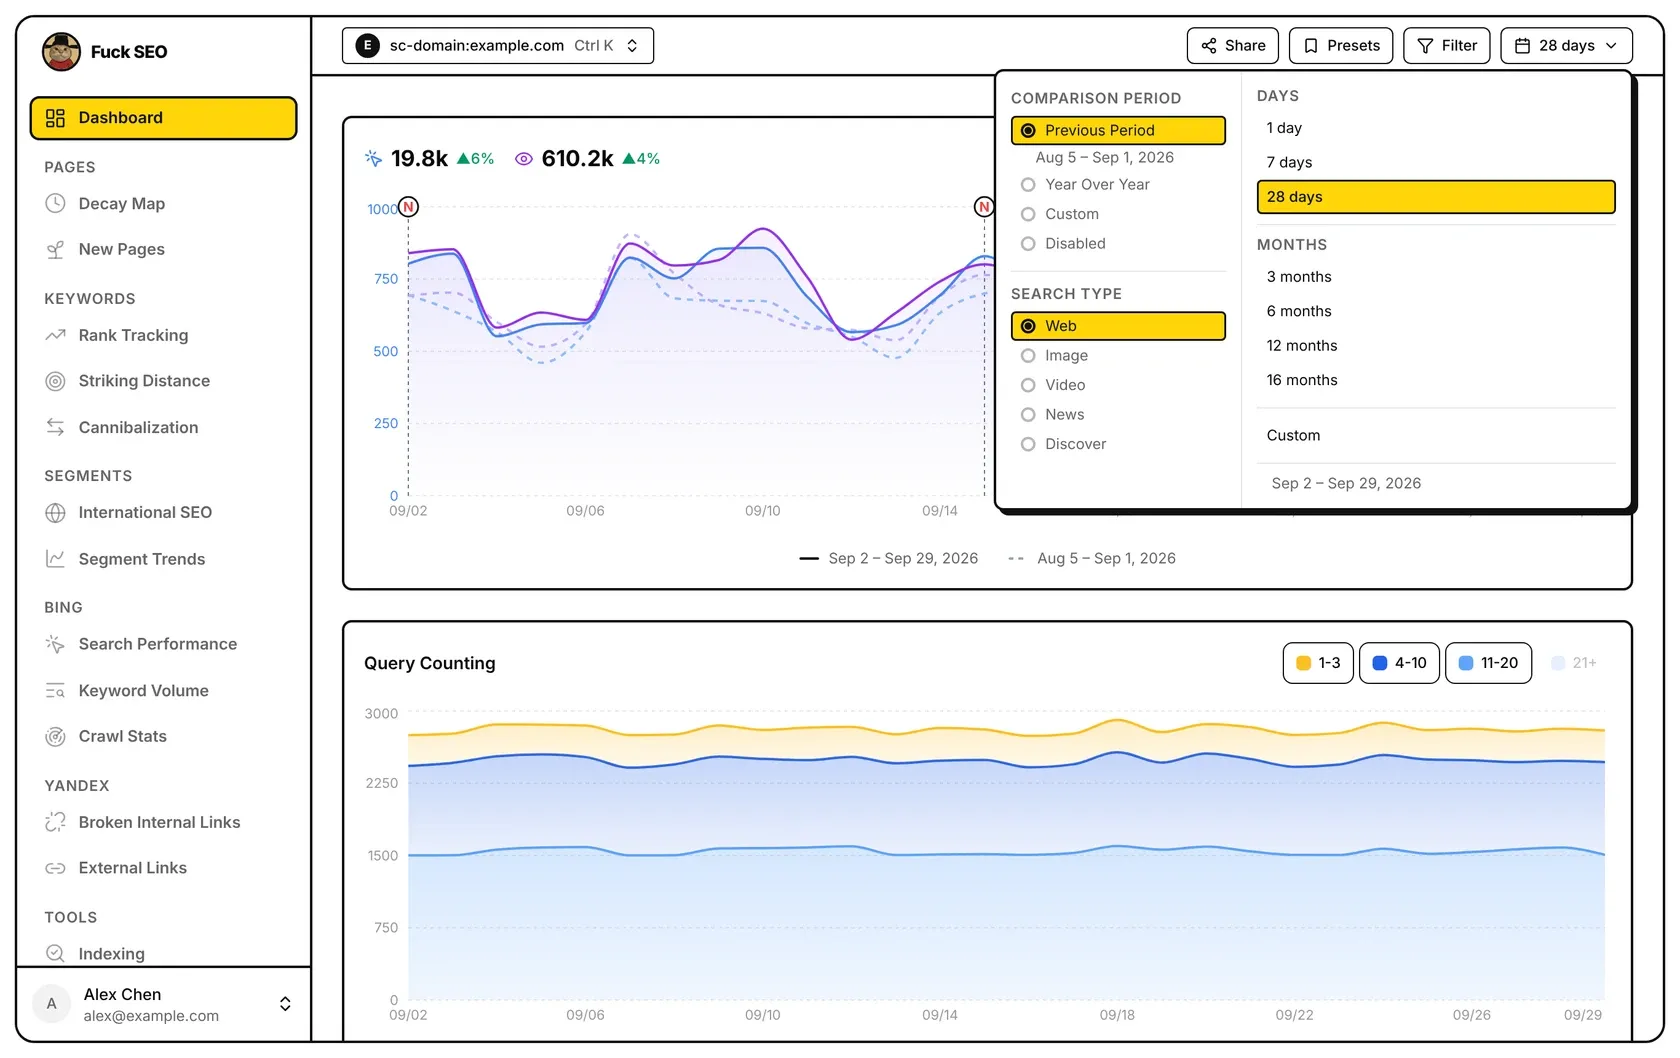
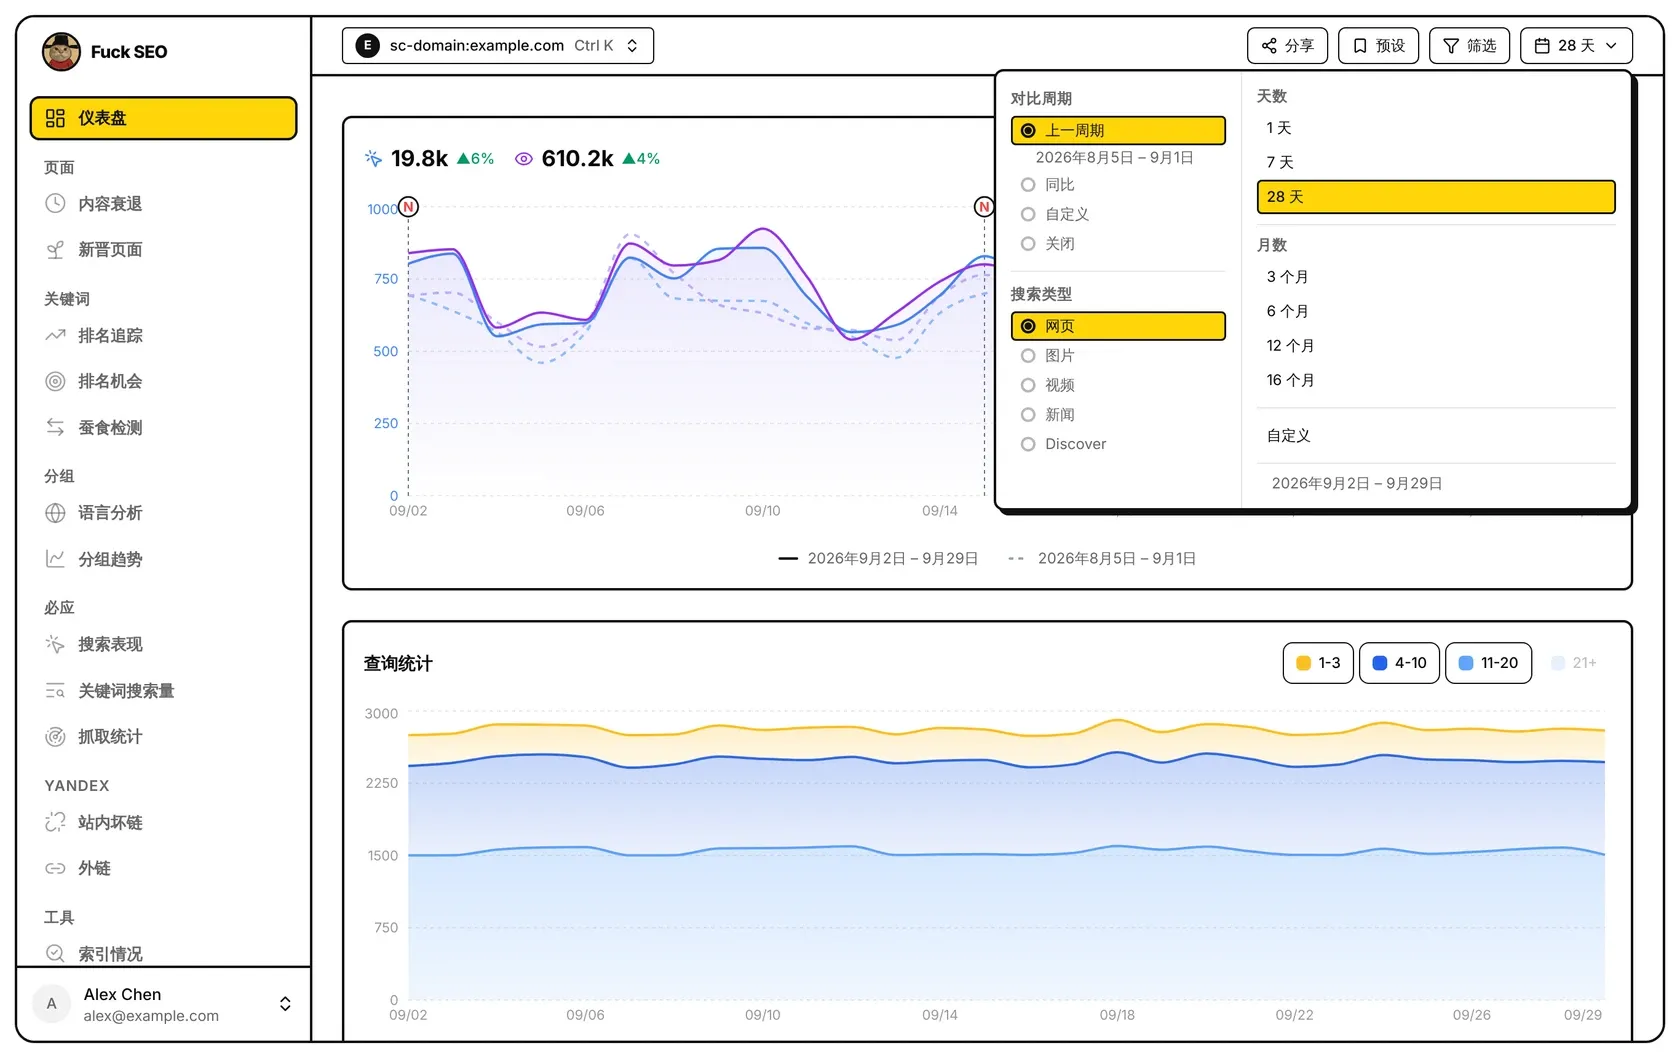
Dates, comparison and search type
Pick Days (1, 7 or 28), Months (3, 6, 12 or 16, counted as 90, 180, 365 and 480 days) or Custom with a start and end date within the last 480 days. Preset ranges end on the latest day Google has final data for. The default is 28 days; a preset range is remembered in this browser, a custom one isn’t.
Comparison Period sets what every change on the Dashboard is measured against:
- Previous Period: the same number of days just before the range (its dates are shown under it).
- Year Over Year: the same range 52 weeks earlier, so weekdays line up. Only for ranges up to 116 days.
- Custom: any two dates, shorter or longer than the range.
- Disabled: no comparison.
Google keeps about 16 months of data, so if the comparison would start more than 480 days before the end date (such as the previous period of a 12-month range), nothing is compared.
Search Type is Web, Image, Video, News or Discover. Discover has no queries, positions or devices, so those parts of the Dashboard are hidden and query and device filters aren’t applied.
Main chart
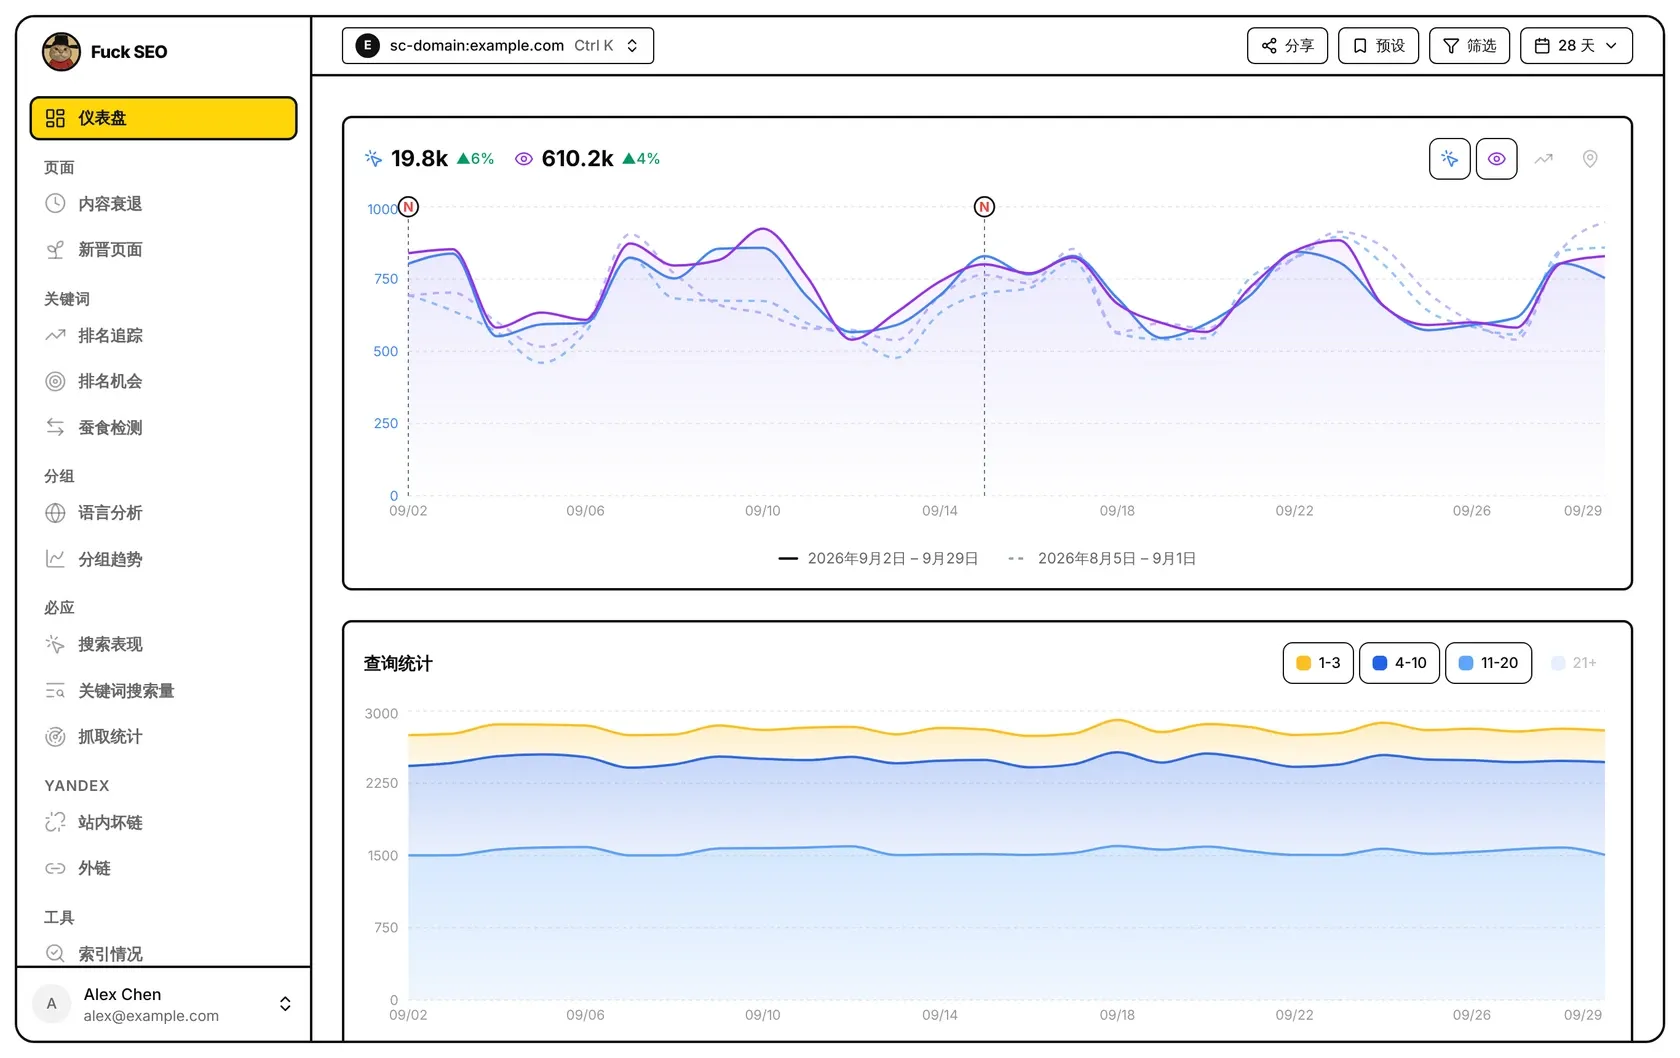
Above the chart are totals for the metrics shown: CTR is total clicks ÷ total impressions and position is weighted by impressions. Each total shows its change against the comparison period, as a percentage for clicks, impressions and CTR, and as the number of places moved for position (green ▲ is better). Hover a change to see the earlier value; ”—” means the earlier period had none.
The buttons on the right turn Clicks, Impressions, CTR and Position on and off. Solid lines are the selected range; lighter dashed lines are the comparison period, matched day by day, with both date ranges in the legend. Hover a day to see both periods’ values.
- An N on a dashed vertical line is a change note; click it to open the note. On a computer, click any day to add a note for it. See Change Notes.
- A light blue band with a G is a Google ranking update from the Google Search Status Dashboard. Hover the G for its name and dates, or click it to open the update.
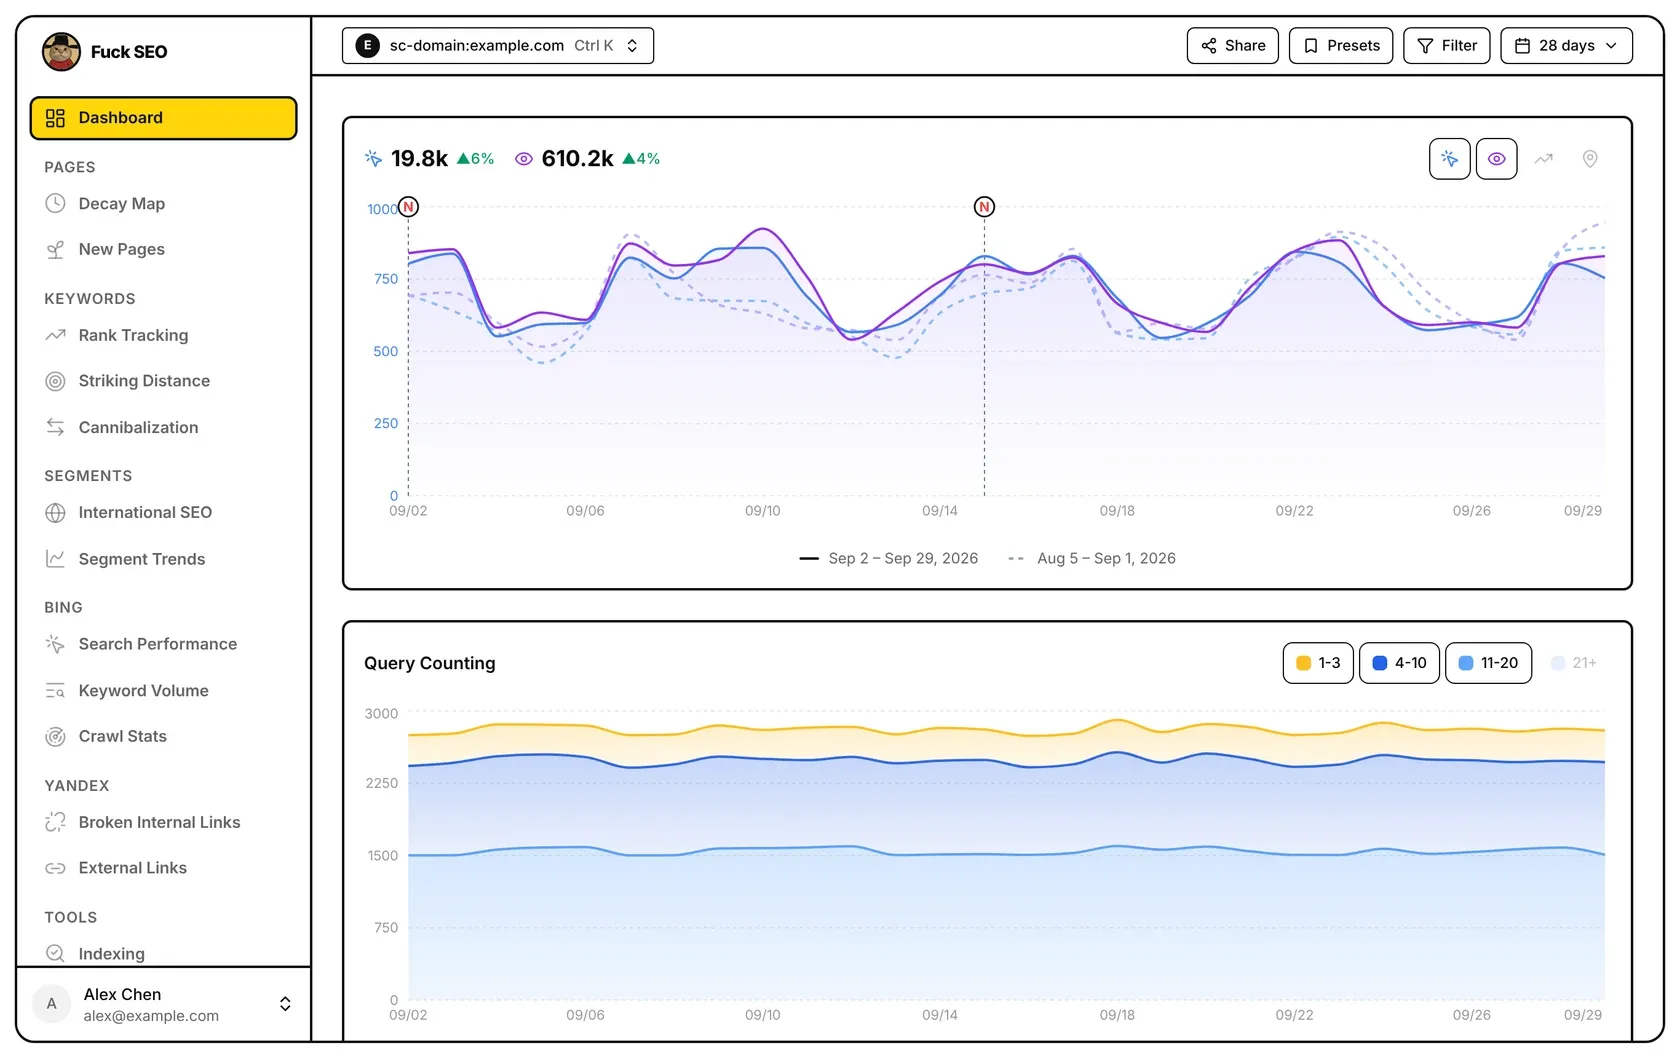
Query Counting
For each day, Query Counting counts the queries that got impressions, split by that day’s average position into 1-3, 4-10, 11-20 and 21+ and stacked. A query that averaged 3.4 counts in 4-10. Only the first three ranges are shown at first; click 21+ to add it. Click a range to hide or show it. The vertical axis fits the ranges shown, and the top line is their sum, which is the total when all four are shown. This chart has no comparison and ignores the toolbar filters.
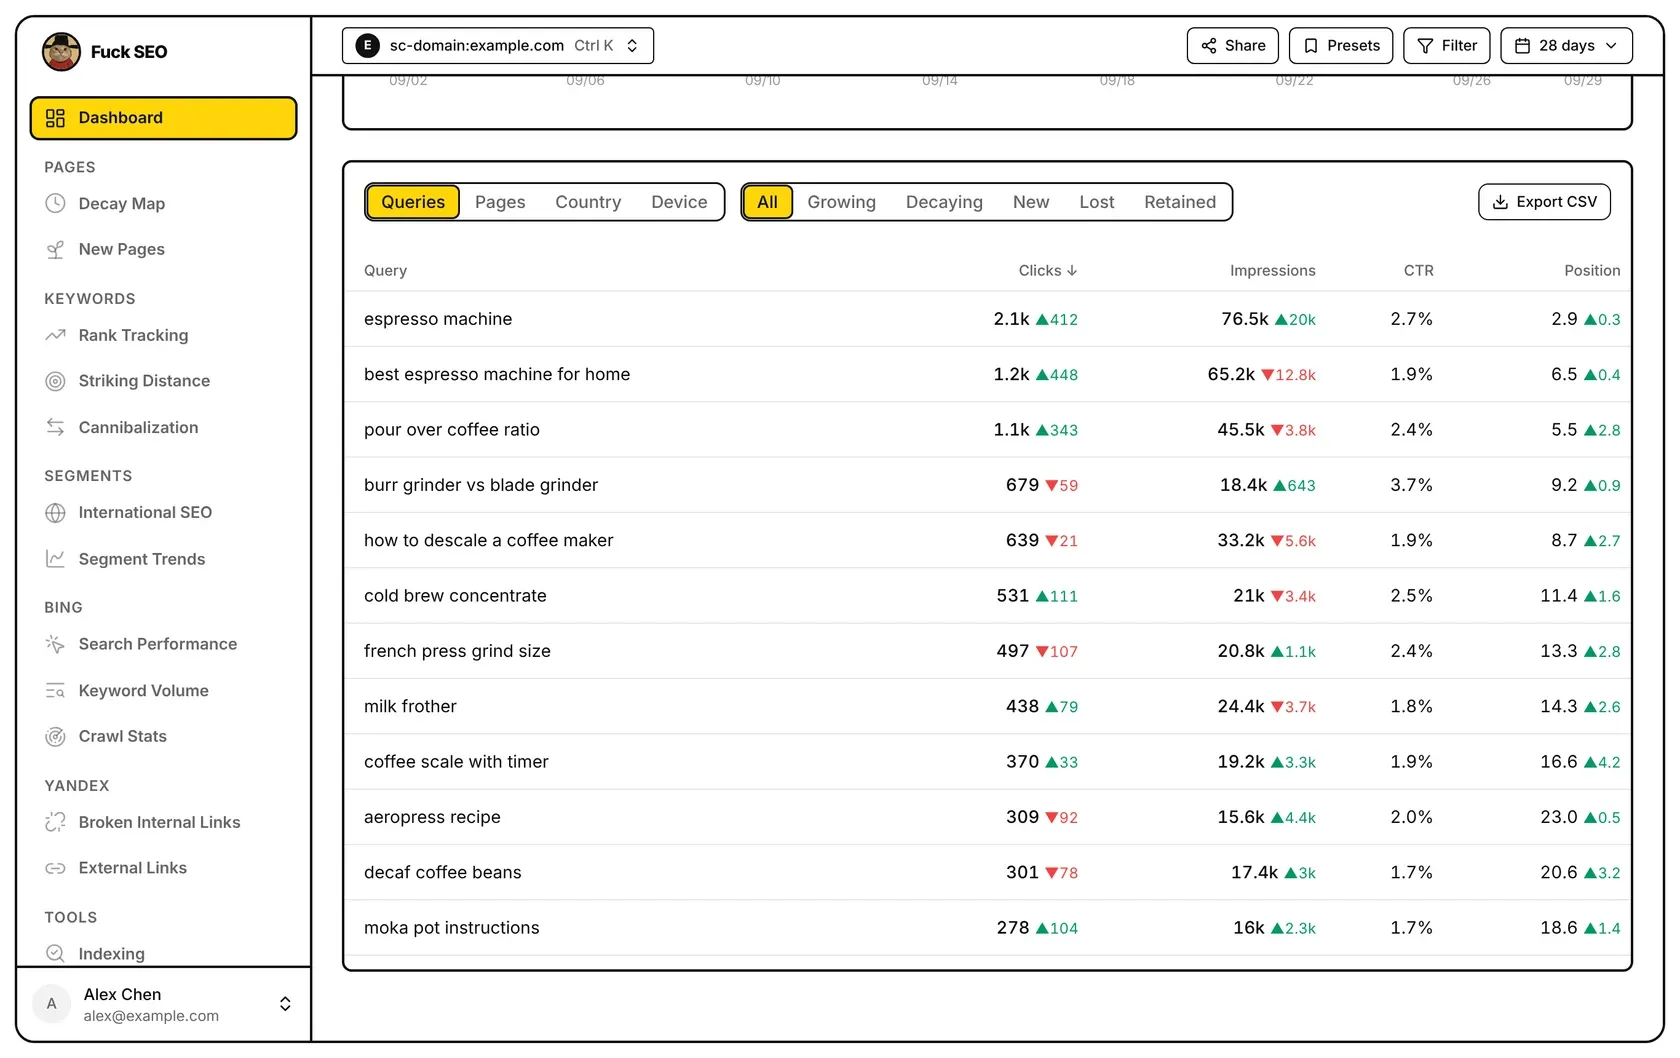
Tables
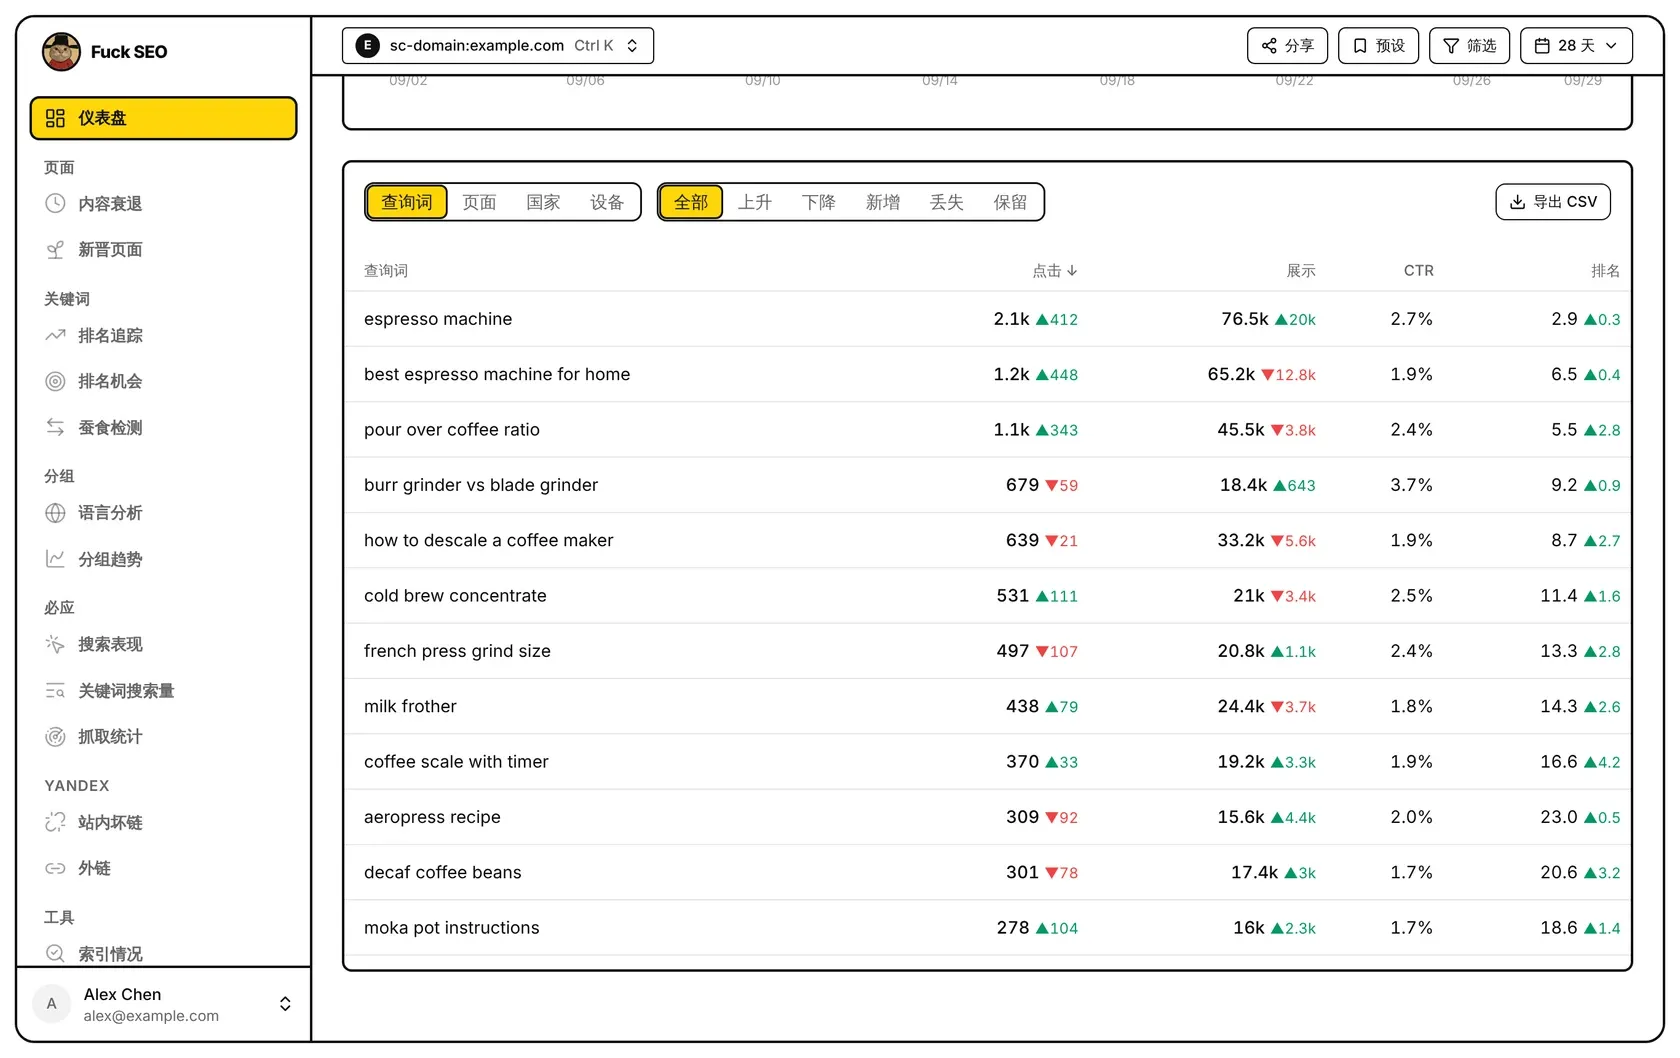
Choose Queries, Pages, Country or Device. Rows show Clicks, Impressions, CTR and Position, with the change against the comparison period beside all but CTR. Queries and pages are the 500 with the most clicks in each period, loading more as you scroll; countries are the top 20.
With a comparison period, the second switch filters rows by clicks: Growing (more than before), Decaying (fewer), New (clicks now, none before), Lost (clicks before, none now) and Retained (clicks in both). A row outside a period’s top 500 counts as 0 clicks there. Country and Device have only All, Growing and Decaying.
Click a column header to sort (Clicks, highest first, by default); click again for Most improved, then Most declined (CTR just reverses the order). Click a country or device row to filter the whole page by it. Export CSV (not on phones) downloads up to 25,000 rows per table with the current dates, comparison and filters. From the Queries or Pages tab you get queries and pages in one file; from Country or Device, that table.
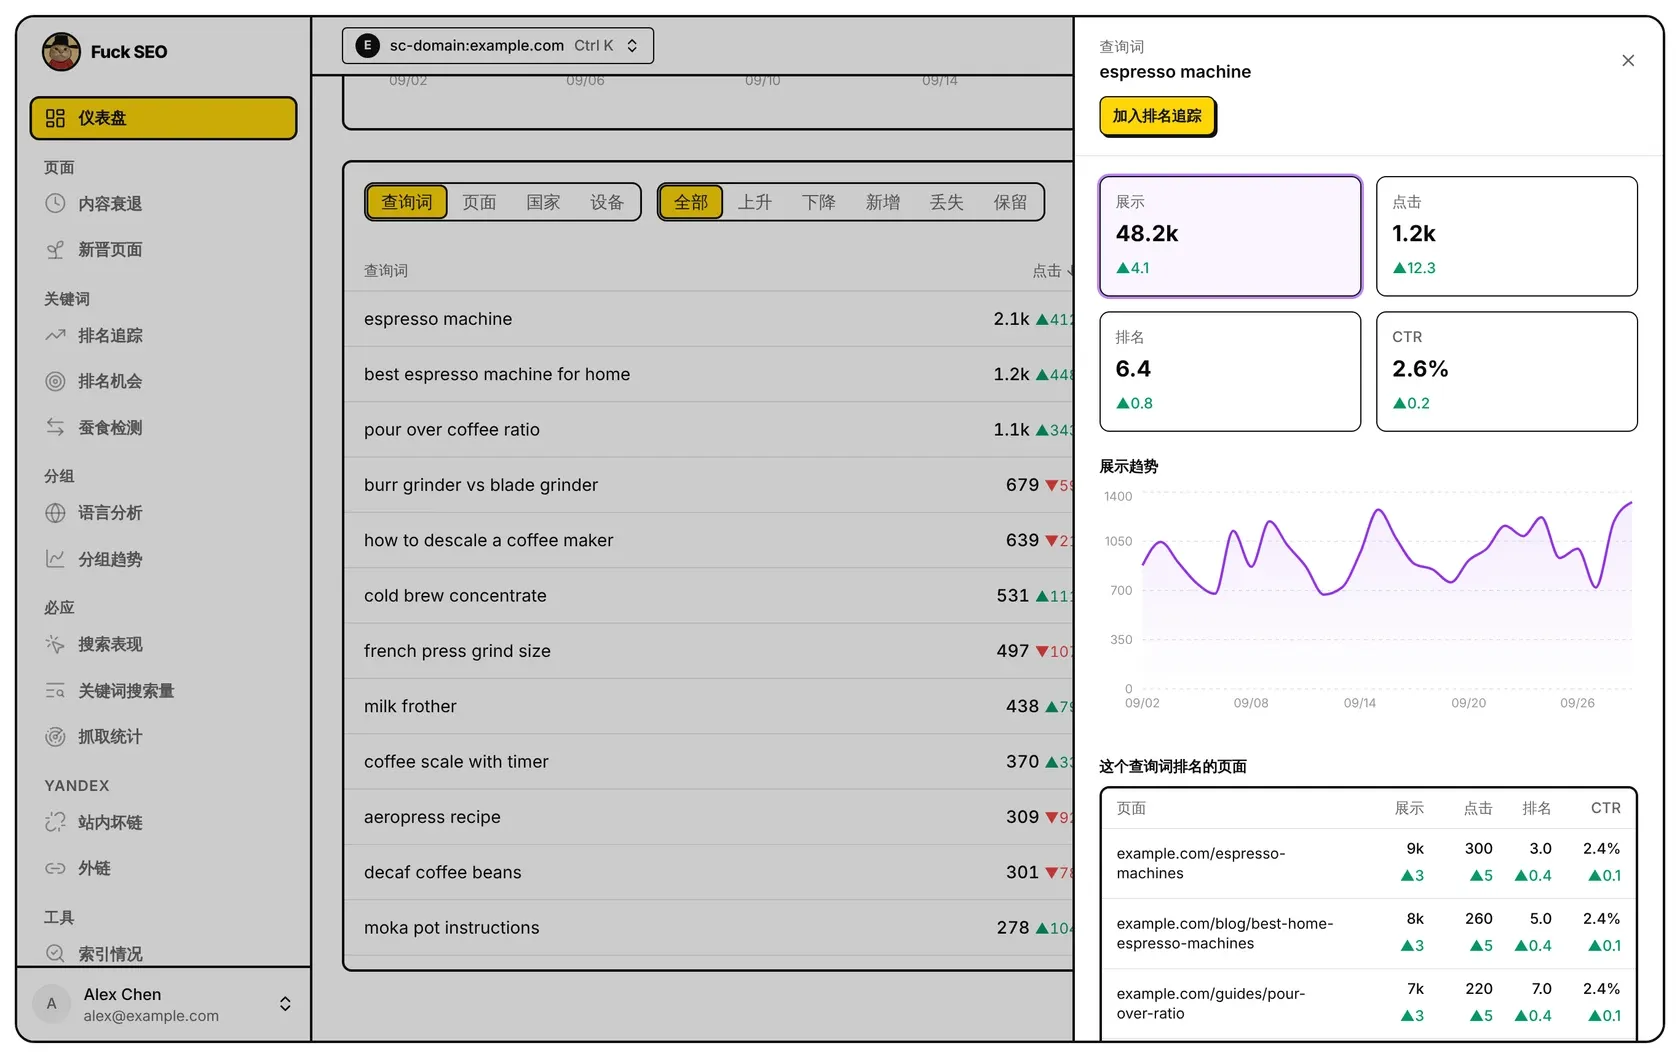
Detail panel
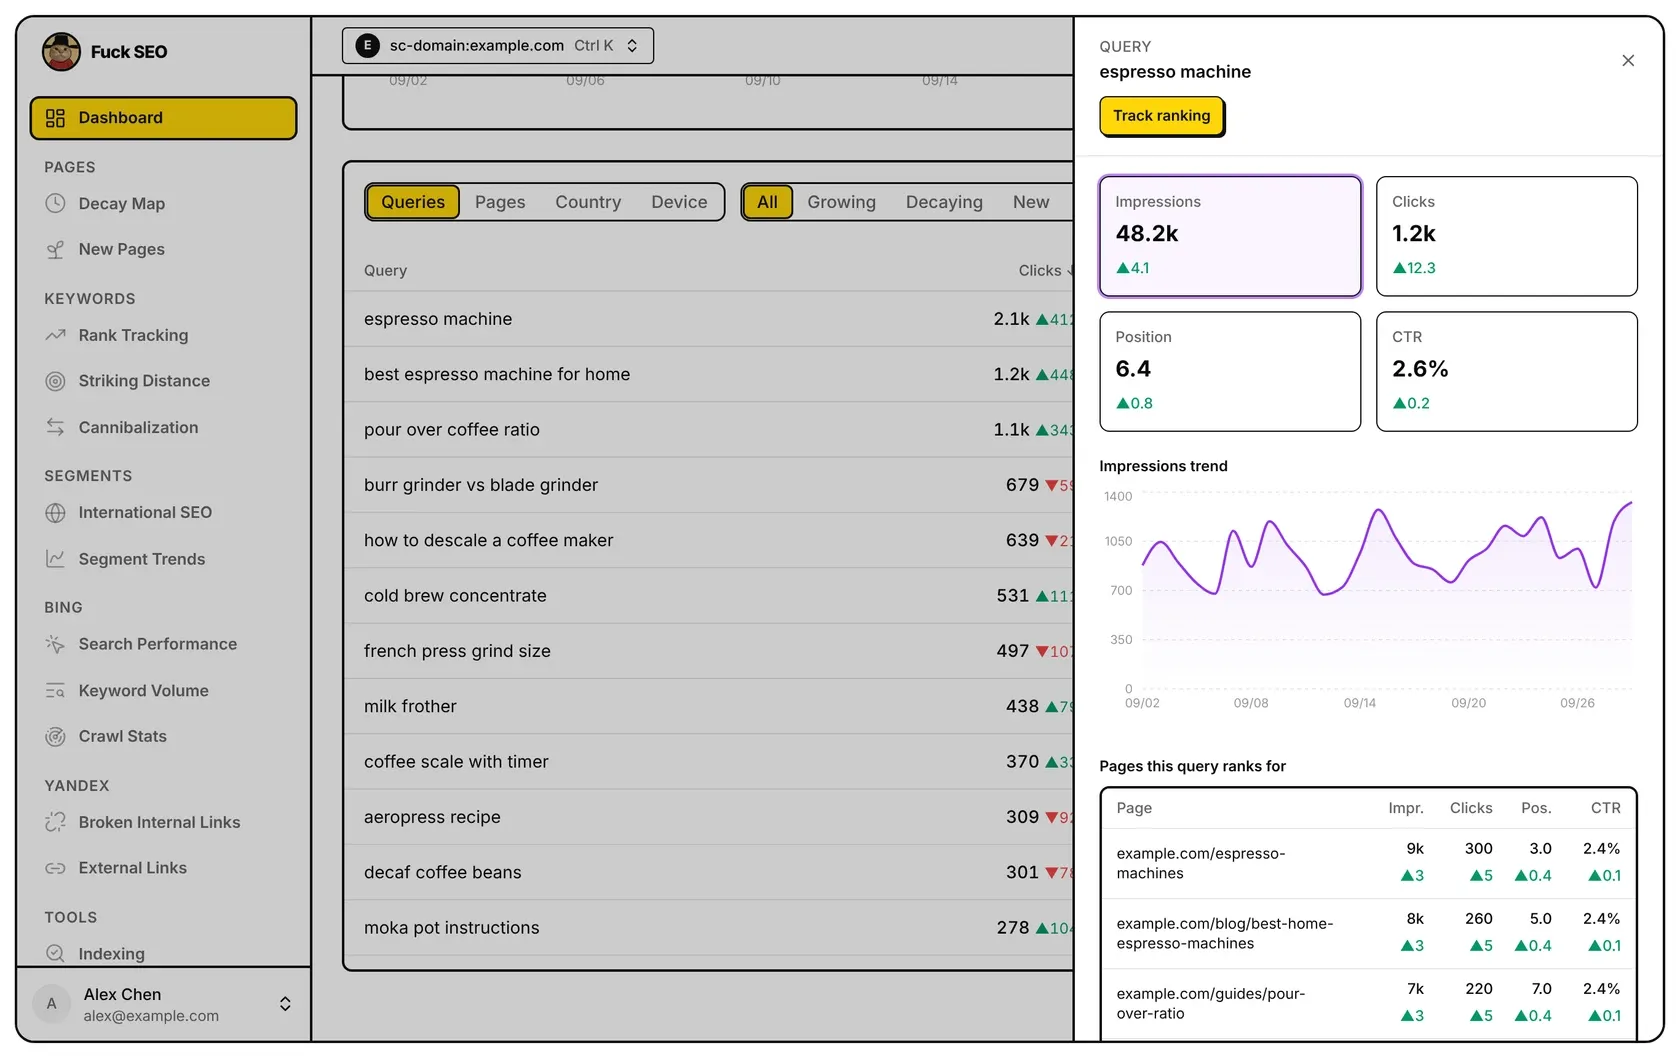
Click a query or page to open its panel. A query has Track ranking, which adds it to Rank Tracking. A page has Check indexing, Add a note and Open page.
Cards for Impressions, Clicks, Position and CTR show each total and its change against the comparison period as an absolute number (CTR in percentage points); click one to chart it by day. A page also lists the notes that apply to it. At the bottom are up to 100 pages this query ranks for, or queries this page ranks for, by impressions; click one to open it, and Back to return.
The panel uses the Dashboard’s dates, search type and comparison, but not its filters. A page’s totals include queries Google doesn’t list, so they can be higher than the sum of the queries shown.
打开站点后看到的第一页就是仪表盘:所选日期的汇总数字和每日曲线(与另一段时间对比)、每个排名区间各有多少查询词,以及查询词、页面、国家和设备的明细表。
顶栏
点左边的站点按钮,或按 ⌘K / Ctrl K,输入网址的一部分即可切换站点;切换后仍停在同一个页面,筛选会清空。右边依次是 分享、预设、筛选(见 分享 和 筛选和预设)和日期菜单。在站点的各个页面之间切换时,选好的日期范围和搜索类型保持不变。
日期、对比周期和搜索类型
可以选 天数(1、7、28 天)、月数(3、6、12、16 个月,分别按 90、180、365、480 天算),或 自定义 开始和结束日期(最早到 480 天前)。预设的日期范围都截止到 Google 已出最终数据的最新一天。默认 28 天;选过的预设范围会记在当前浏览器里,自定义日期不记。
对比周期 决定仪表盘上所有涨跌和谁比:
- 上一周期:紧挨在所选范围前面、天数相同的一段,日期显示在选项下方。
- 同比:往前 52 周的同一段日期,星期几对得上。只适用于不超过 116 天的范围。
- 自定义:任选两个日期,长度可以和所选范围不同。
- 关闭:不对比。
Google 只保留约 16 个月的数据,所以对比段的起点早于结束日期往前 480 天时(比如 12 个月范围的上一周期),就不做对比。
搜索类型 可选 网页、图片、视频、新闻 和 Discover。Discover 没有查询词、排名和设备数据,仪表盘上对应的部分会隐藏,按查询词和设备的筛选也不生效。
主图表
图表上方是当前显示的指标的汇总:CTR 是总点击 ÷ 总展示,排名按展示量加权平均。每个汇总旁边是与对比周期相比的变化,点击、展示和 CTR 显示百分比,排名显示名次差(绿色 ▲ 表示变好)。鼠标移到变化上可以看到对比周期的数值;对比周期为 0 时显示 ”—”。
右边的按钮可以打开或关闭 点击、展示、CTR 和 排名 曲线。实线是所选范围,同色浅一档的虚线是对比周期,按天一一对应,图例写着两段的日期。鼠标移到某一天,可以看到两段的数值。
- 虚线竖线顶上的 N 是一条变更笔记,点它可以打开笔记。在电脑上点曲线上任意一天,可以给那天记一条笔记,见 变更笔记。
- 带 G 图标的浅蓝色区域是 Google 搜索状态信息中心公布的排名更新。鼠标移到 G 上显示更新名称和起止日期,点它可以打开那次更新的页面。
查询统计
查询统计 按天统计有展示的查询词数量,按当天的平均排名分成 1-3、4-10、11-20 和 21+ 四段叠在一起。某个查询词当天平均排名 3.4,就算在 4-10 里。默认只显示前三段,点 21+ 可以加上;点上方任一区间都可以隐藏或显示这一段。纵轴按显示的几段缩放,最上面那条线是这几段的合计,四段都显示时就是总数。这张图不做对比,也不受顶栏筛选影响。
明细表
可以切换 查询词、页面、国家 和 设备。每行显示 点击、展示、CTR 和 排名,除 CTR 外都带有与对比周期相比的变化。查询词和页面取每段时间里点击最多的 500 个,往下滚动会继续加载;国家取前 20 个。
有对比周期时,第二组按钮按点击筛选:上升(比之前多)、下降(比之前少)、新增(现在有点击、之前没有)、丢失(之前有点击、现在没有)、保留(两段都有点击)。不在某段前 500 名里的行,在那一段按 0 次点击算。国家和设备只有全部、上升和下降。
点列标题按该列排序(默认按点击从高到低),再点一次是 变好最多,再点是 变差最多(CTR 只是正序倒序切换)。点国家或设备的某一行,会按它筛选整个页面。导出 CSV(手机上不显示)按当前的日期、对比周期和筛选导出,每张表最多 25,000 行:在查询词或页面下导出的文件同时包含查询词和页面,在国家或设备下导出当前这张表。
详情面板
点一个查询词或页面,右侧会滑出它的详情面板。查询词面板有 加入排名追踪,会把它加进 排名追踪;页面面板有 检查收录、记一条笔记 和 打开页面。
展示、点击、排名 和 CTR 四张卡片显示数值和与对比周期相比的变化(变化是绝对值,CTR 为百分点);点哪张卡片,下面的趋势图就按天显示哪个指标。页面面板还会列出适用于这个页面的笔记。最下面按展示量列出这个查询词排名的页面(或这个页面排名的查询词),最多 100 条;点一行可以打开它,点 返回 回到上一层。
面板沿用仪表盘的日期、搜索类型和对比周期,但不受筛选影响。页面的汇总包含 Google 不列出的查询词,所以可能比下面列出的查询词加起来更多。