Help Center帮助中心 Bing必应
Bing Search Performance必应搜索表现
Last updated更新于 2026-10-17
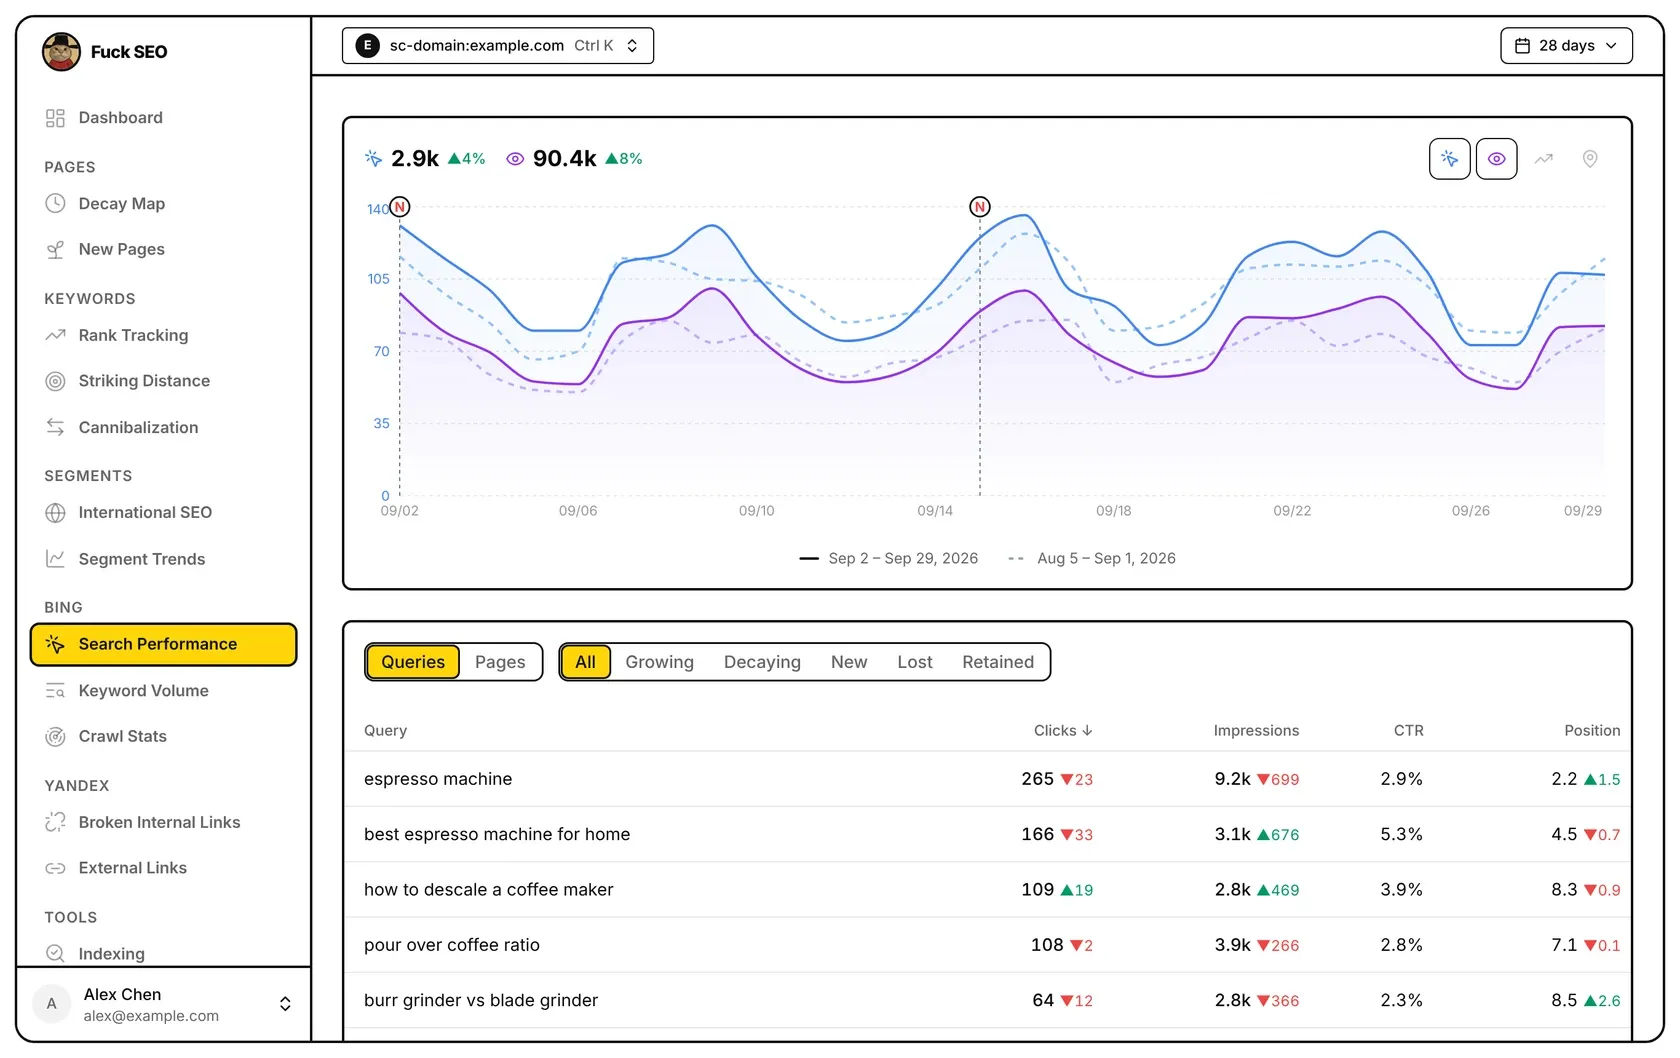
Search Performance, in the Bing section of the sidebar, shows how the site does in Bing search: totals and a daily chart of clicks and impressions for the dates you pick, compared with an earlier period, and tables of the queries and pages Bing reports. The data comes from your Bing Webmaster Tools account, not from Search Console.
Where the data comes from
- When you open the page, Fuck SEO reads three things from the Bing Webmaster Tools API: the site’s daily clicks and impressions, Bing’s query report and Bing’s page report. Opening the detail panel described below also reads Bing’s report for that query or page, and for a page, Bing’s crawl record for the URL.
- Access is read-only: Fuck SEO can’t change anything in your Bing account.
- Bing’s data isn’t stored in our database. What Bing returns is kept on our server until the end of the day (China Standard Time) for the same site, so changing the dates or the comparison period that day, or opening the same query or page’s detail panel again, uses it instead of asking Bing.
- There is no Share button on this page, and interactive share links don’t include the Bing pages.
If the Bing API returns an error, the page shows it, with Bing’s own message, and a Retry button.
Connect Bing
Until you connect, the page shows Connect Bing Webmaster Tools. Click Connect Bing and allow access on Bing’s page; you then come back to the page you started from. One connection covers all the Bing pages for all your sites.
You can also connect from the Bing Webmaster Tools card in Settings (in the account menu at the bottom of the sidebar). Once connected, the card shows when you connected and how many sites are in your Bing account. Disconnect deletes the Bing authorization Fuck SEO saved, and the Bing pages show the connect panel again. If Bing no longer accepts the authorization, for example because access was removed on Bing’s side, the page also shows the connect panel again.
Which Bing site is used
Bing Webmaster Tools has its own list of sites. The page matches this Search Console property against it:
- URL-prefix property: the Bing site with the same address, ignoring letter case and a trailing slash.
- Domain property: every Bing site on the domain or one of its subdomains. The one on the domain itself comes first, then the
www.one, with https before http.
If nothing matches, the page says This site isn’t in your Bing account and shows no data until the site is in Bing Webmaster Tools.
When several Bing sites match, a Bing site row above the chart lists them, and the first one is used. Click another one to switch. Your choice is remembered in this browser for this property, and Keyword Volume and Crawl Stats use the same choice.
Dates and comparison
The top bar has only the date menu: there are no Presets or Filter buttons, and the menu has no Search Type. Its date ranges and Comparison Period options are the same as on the Dashboard, and the dates you pick stay selected as you move between the site’s pages. On this page the dates follow Bing’s data rather than Search Console’s:
- Preset ranges end on the latest day Bing has data for the site.
- If the range starts before Bing’s first day of data, the chart starts at that day. Custom dates can only be picked between Bing’s first and last days of data, at most 480 days back.
- Comparison Period is Previous Period (the default), Year Over Year (for ranges up to 116 days), Custom or Disabled. Nothing is compared when the comparison would start before Bing’s first day of data, or more than 480 days before the end date.
Chart
The chart works like the Dashboard’s main chart:
- Above it are totals for the metrics shown, each with its change against the comparison period: a percentage for clicks, impressions and CTR, and the number of places moved for position (green ▲ is better). Hover a change to see the earlier value; ”—” means the earlier period had none.
- The buttons on the right turn Clicks, Impressions, CTR and Position on and off. Solid lines are the selected range; lighter dashed lines are the comparison period, matched day by day, with both date ranges in the legend. Hover a day to see both periods’ values.
- An N on a dashed vertical line is a change note, from the same notes as the site’s other pages. Click it to open the note; on a computer, click any day to add a note for it. See Change Notes. Google ranking updates aren’t shown on this chart.
How Bing’s numbers are used:
- Clicks and Impressions are Bing’s daily totals for the site, added up over the range. CTR is total clicks ÷ total impressions.
- Position uses Bing’s average position. Each day’s position is the average of that day’s query positions, weighted by impressions, and the total weights each day by its impressions. The Position button appears only when Bing has a position for every day with impressions; otherwise the chart has clicks, impressions and CTR.
When Bing has no data in the selected dates, the chart is replaced by “Bing has no search data for this site in these dates”.
Queries and pages
Choose Queries or Pages. The tables come from Bing’s query and page reports, added up over the selected dates, and list every row Bing returns.
- Rows show Clicks, Impressions, CTR and Position, with the change against the comparison period beside all but CTR. Hover a value to see the comparison period’s.
- CTR is clicks ÷ impressions. Position is Bing’s daily positions averaged by impressions; days without a position don’t count, and ”—” means there is none.
- Pages show the path for a URL-prefix property, and the host name and path for a Domain property.
With a comparison period, the second switch filters rows by clicks: Growing (more than before), Decaying (fewer), New (clicks now, none before), Lost (clicks before, none now) and Retained (clicks in both). Queries and pages that Bing reports only in the comparison period are listed too, with 0 clicks for the selected dates.
Click a column header to sort (Clicks, highest first, by default); click again for Most improved, then Most declined (CTR just reverses the order). Rows without a value to sort by, such as a row without a position when sorting by position, stay at the bottom. Rows load 50 at a time as you scroll. This page has no Export CSV.
On phones each query or page takes two lines: the name, then the numbers.
Detail panel
Click a row in the table to open a detail panel for that query or page on the right; you can also Tab to a row and press Enter. Press Esc, click outside the panel or click × in its corner to close it; on phones the back button closes it too. The panel only shows data and has no other buttons.
- The four cards at the top are Impressions, Clicks, Position and CTR for the selected dates, each with its change against the comparison period (a lower position number is better). The change shows ”—” when there is no comparison period, or when one of the periods has no position or no impressions. Click a card to chart that metric below; Clicks is charted first.
- In the query and page panels, the four numbers and the trend come from the same query or page report as the table, so they match the row you clicked. The trend has one point for each date in Bing’s report.
- A query panel then lists Pages this query ranks for, and a page panel lists Queries this page ranks for. The list comes from Bing’s report for that query or page, added up over the selected dates, with each row’s change against the comparison period. Rows with the most clicks come first, and only rows with data in the selected dates are listed. Bing’s reports include only the queries and pages Bing chooses to return, so the list can add up to less than the numbers at the top.
- A page panel also has Bingbot on this URL: HTTP status, File size, and the First discovered and Last crawled dates, from Bing’s record of the URL. Anything Bing doesn’t give shows ”—”.
- Click a row in the list to see that query on that page: the four numbers and the trend come from Bing’s report for the query and page together, with no list below. Back returns to the panel you started from.
If Bing has no search data for the site, the panel says “No data”. If the Bing API returns an error, the panel shows it with a Retry button.
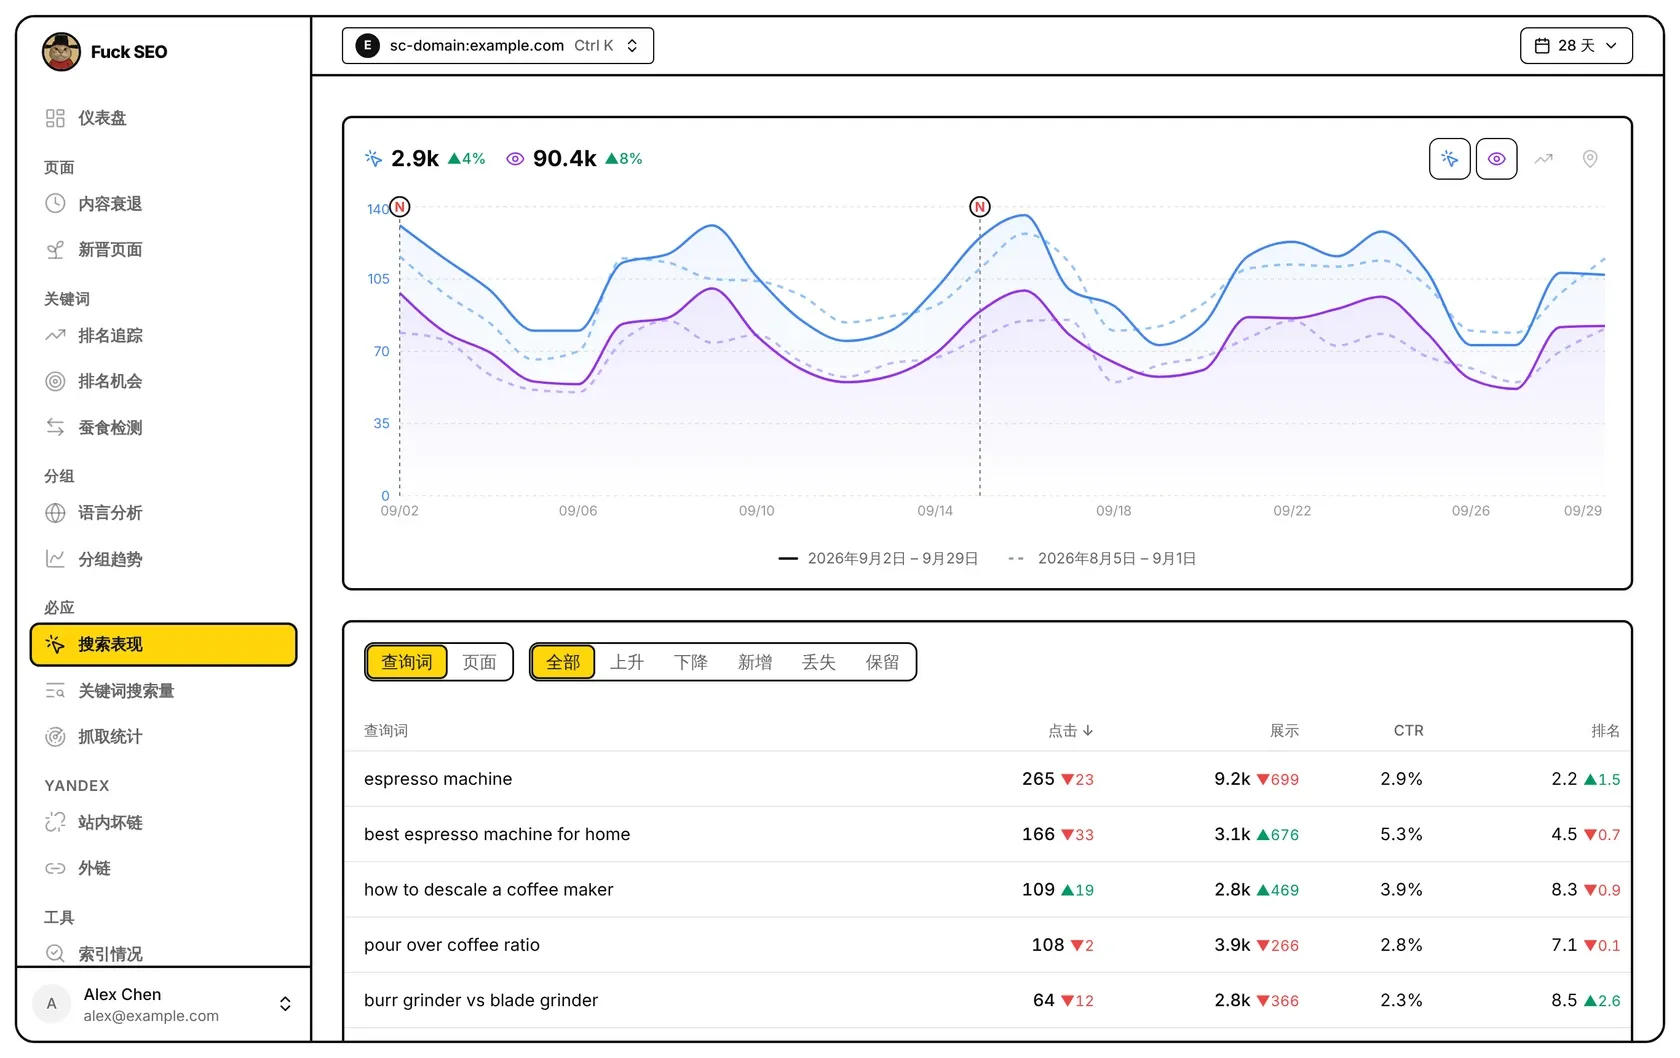
搜索表现在侧边栏的 必应 分组里,显示这个站在必应搜索中的表现:所选日期的汇总数字和每日点击、展示曲线(与另一段时间对比),以及必应给出的查询词和页面明细表。数据来自你的必应 Webmaster Tools 账号,不是 Search Console。
数据来源
- 打开页面时,Fuck SEO 从必应 Webmaster Tools 接口读取三样东西:这个站每天的点击和展示、必应的查询词报告和页面报告。打开下文的详情面板时,再读取必应对这个查询词或页面的报告,页面还会读取必应对这个网址的抓取记录。
- 权限是只读的,Fuck SEO 无法修改你必应账号里的任何东西。
- 我们的数据库不保存必应的数据。同一个站从必应读到的数据在我们的服务器上保留到当天结束(北京时间),当天再换日期或对比周期、再打开同一个查询词或页面的详情面板,都直接用这份数据,不再向必应读取。
- 这个页面没有 分享 按钮,互动分享链接里也没有必应的页面。
必应接口出错时,页面显示错误信息(带上必应的原话)和 重试 按钮。
连接必应
还没连接时,页面显示 连接必应 Webmaster Tools。点 连接必应,在必应的页面上允许访问,之后会回到你出发的那个页面。连接一次,所有站点的必应页面都能用。
也可以在 系统设置(侧边栏底部的账号菜单里)的 Bing Webmaster Tools 卡片里连接。连接后,卡片显示连接日期和你必应账号里有几个站点。点 断开 会删除 Fuck SEO 保存的必应授权,必应的页面重新显示连接提示。必应不再接受这个授权时(例如在必应那边取消了访问),页面也会重新显示连接提示。
用哪个必应站点
必应 Webmaster Tools 有自己的站点列表,页面用这个 Search Console 资源去对应:
- 网址前缀资源:地址相同的必应站点,不区分大小写,也不管结尾的斜杠。
- 网域资源:这个域名及其子域名下的所有必应站点。域名本身的排在最前,其次是
www.的,同一个主机名 https 排在 http 前面。
一个都对应不上时,页面显示 你的必应账号里没有这个站,站点加到必应 Webmaster Tools 之后才有数据。
对应上好几个必应站点时,曲线图上方有一行 必应站点 列出它们,默认用第一个,点另一个即可切换。你的选择按 Search Console 资源记在这个浏览器里,关键词搜索量 和 抓取统计 也用同一个选择。
日期和对比周期
顶栏只有日期菜单:没有 预设 和 筛选 按钮,菜单里也没有 搜索类型。菜单里的日期范围和 对比周期 选项与 仪表盘 相同,在站点的各个页面之间切换时,选好的日期保持不变。在这个页面上,日期按必应的数据走,而不是 Search Console 的:
- 预设的日期范围截止到必应有这个站数据的最新一天。
- 所选范围早于必应有数据的第一天时,曲线从那一天开始。自定义 日期只能在必应有数据的第一天和最后一天之间选,最早到 480 天前。
- 对比周期 可选 上一周期(默认)、同比(只适用于不超过 116 天的范围)、自定义 或 关闭。对比段的起点早于必应有数据的第一天,或早于结束日期往前 480 天时,就不做对比。
曲线图
曲线图和仪表盘的主图表一样:
- 图表上方是当前显示的指标的汇总,旁边是与对比周期相比的变化:点击、展示和 CTR 显示百分比,排名显示名次差(绿色 ▲ 表示变好)。鼠标移到变化上可以看到对比周期的数值;对比周期为 0 时显示 ”—”。
- 右边的按钮可以打开或关闭 点击、展示、CTR 和 排名 曲线。实线是所选范围,同色浅一档的虚线是对比周期,按天一一对应,图例写着两段的日期。鼠标移到某一天,可以看到两段的数值。
- 虚线竖线顶上的 N 是一条变更笔记,和站点其他页面用的是同一批笔记。点它可以打开笔记;在电脑上点曲线上任意一天,可以给那天记一条笔记,见 变更笔记。这张图上不显示 Google 的排名更新。
必应的数字这样计算:
- 点击 和 展示 是必应给出的这个站每天的总数,按所选日期相加。CTR 是总点击 ÷ 总展示。
- 排名 用的是必应的平均排名。每天的排名是当天各查询词的排名按展示量加权平均,汇总再按每天的展示量加权。必应在每个有展示的日子都有排名时,才有 排名 按钮,否则曲线图只有点击、展示和 CTR。
所选日期内必应没有数据时,曲线图的位置显示「所选日期内必应没有这个站的搜索数据」。
查询词和页面
可以切换 查询词 和 页面。明细表来自必应的查询词报告和页面报告,按所选日期汇总,列出必应返回的全部行。
- 每行显示 点击、展示、CTR 和 排名,除 CTR 外都带有与对比周期相比的变化。鼠标移到数值上可以看到对比周期的数值。
- CTR 是点击 ÷ 展示。排名 是必应每天的排名按展示量加权平均,没有排名的日子不计入,没有排名时显示 ”—”。
- 页面在网址前缀资源下显示路径,在网域资源下显示域名加路径。
有对比周期时,第二组按钮按点击筛选:上升(比之前多)、下降(比之前少)、新增(现在有点击、之前没有)、丢失(之前有点击、现在没有)、保留(两段都有点击)。必应只在对比周期里报告的查询词和页面也会列出,所选日期的点击按 0 算。
点列标题按该列排序(默认按点击从高到低),再点一次是 变好最多,再点是 变差最多(CTR 只是正序倒序切换)。没有可排序数值的行始终排在最后,例如按排名排序时没有排名的行。往下滚动时每次多加载 50 行。这个页面没有 导出 CSV。
手机上每个查询词或页面占两行,上面是名称,下面是数字。
详情面板
点表格里的一行,右侧打开这个查询词或页面的详情面板;用 Tab 选中一行再按回车也可以。按 Esc、点面板外面或右上角的 × 关闭,手机上按返回键也能关闭。面板里只有数据,没有其他按钮。
- 顶部四张卡片是所选日期的 展示、点击、排名 和 CTR,下面是与对比周期相比的变化(排名数字变小是变好);没有对比周期,或其中一段没有排名或展示时,变化显示 ”—“。点一张卡片,下面的趋势图就画这个指标,默认是点击。
- 查询词和页面面板的四个数字和趋势用的是上面同一份查询词或页面报告,和表格里那一行一致。趋势图按必应报告里的日期画点,每个日期一个点。
- 查询词面板下面列出 这个查询词排名的页面,页面面板列出 这个页面排名的查询词。列表来自必应对这个查询词或页面的报告,按所选日期汇总,每行带与对比周期相比的变化,点击多的排在前面,只列所选日期内有数据的行。必应的报告只包含它给出的那部分查询词和页面,所以列表加起来可能少于面板顶部的数字。
- 页面面板还有一块 必应爬虫(Bingbot)对这个网址:状态码、文件大小、首次发现 和 最近抓取 的日期,来自必应对这个网址的记录。必应没有给出的项显示 ”—”。
- 在列表里点一行,面板换成这个查询词加这个页面:四个数字和趋势来自必应对这个查询词加页面的报告,下面没有列表。点 返回 回到原来的面板。
必应没有这个站的搜索数据时,面板显示「暂无数据」;必应接口出错时,面板显示错误信息和 重试 按钮。