Help Center帮助中心 Pages页面
Decay Map内容衰退
Last updated更新于 2026-10-09
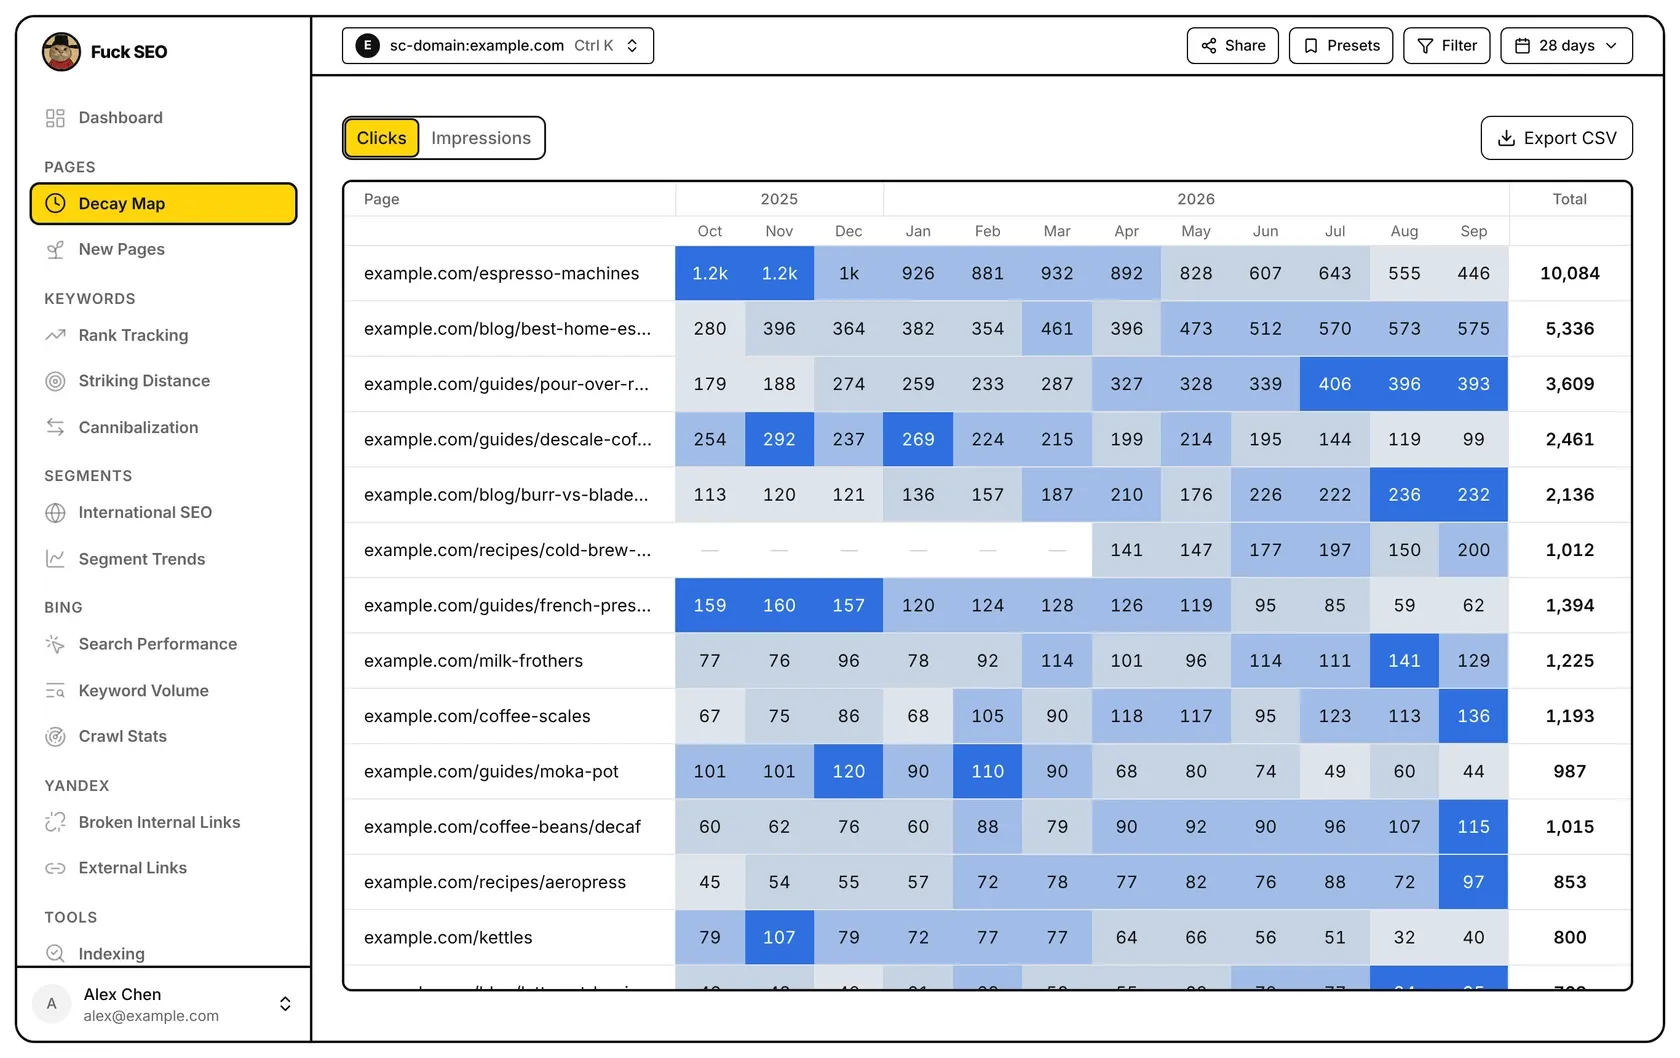
The Decay Map shows how each page’s clicks or impressions changed month by month over the last 12 complete months. Each row is a page, each cell is one calendar month, and the shading compares that month with the page’s own average, so you can scan the monthly pattern of many pages at once.
Which months are shown
The table always covers 12 calendar months, grouped under their year. The last column is the last complete month: the latest month whose final Search Console data reaches its last day. In the first days of a month, until the previous month’s last day has final data, the table still ends one month earlier.
The date range in the top bar doesn’t change these 12 months; it only sets the period used in the detail panel (see below). Filters from Filter or Presets and the Search Type in the date menu do apply.
Clicks or impressions
Use the Clicks / Impressions switch above the table. The cells, the Total column and the CSV export all follow the selected metric. Clicks are shaded blue and impressions purple, the same colors as the Dashboard chart.
Reading the cells
- Numbers: a cell shows the page’s clicks or impressions in that month. Values from 1,000 up are shortened (1.5k, 69k, 1.2M); hover a cell to see the exact number.
- Shading: each cell is compared with the page’s average month, which is the average of its months with data, counted from the page’s first month with impressions. There are six shades, from lightest to darkest: under 0.4 times the average, 0.4 to 0.7, 0.7 to 1, 1 to 1.3, 1.3 to 2, and 2 times or more. Every row is scaled to itself, so the darkest cell of a small page and the darkest cell of a large page both mean “high for that page”, not the same number.
- Empty cell: a real zero. The page already had impressions in an earlier month, but this month it had no clicks (or no impressions, in the Impressions view).
- ”—”: the page had no impressions yet. Every month before a page’s first month with impressions shows ”—” (hover: “No impressions yet this month”). The first month is always taken from impressions, even in the Clicks view, so a page that had impressions but no clicks for a while isn’t shown as a run of zeros.
Which pages are listed
Pages are sorted by Total, the sum of the 12 months, from highest to lowest; this order can’t be changed. Rows load 50 at a time as you scroll. The Total column isn’t shaded, and shows ”—” for a page with no impressions in all 12 months.
If the site has sitemaps submitted in Search Console, the list is matched against the URLs in them: pages with data that aren’t in any sitemap are left out, and sitemap URLs with no impressions in the 12 months are added at the bottom as rows of ”—”. When the site also has a main sitemap, sitemaps in language folders such as /fr/ or /de/ aren’t used. If there is no sitemap, or none can be read, every page with data is listed.
For a Domain property, pages are shown with their host name because the property can include several subdomains; for a URL-prefix property only the path is shown.
If more than 100,000 pages had data in one month, only the 100,000 with the most clicks are loaded for that month. Its header gets a * and a notice appears above the table: a page showing 0 in that month may simply have been outside the top 100,000.
Open a page
Click a row to open the page’s detail panel. It uses the date range from the top bar, not the 12 months: clicks, impressions, position and CTR with their change against the previous period, a daily trend chart (starting on the metric you were viewing), the page’s notes and the queries it ranks for. The panel also has Check indexing, which opens Indexing with this URL added, Add a note and Open page.
Export
Export CSV downloads every listed page, including rows you haven’t scrolled to: the full URL, one column per month (YYYY-MM) and the total, for the selected metric. Months before a page’s first impressions are exported as 0. The button isn’t shown on phones.
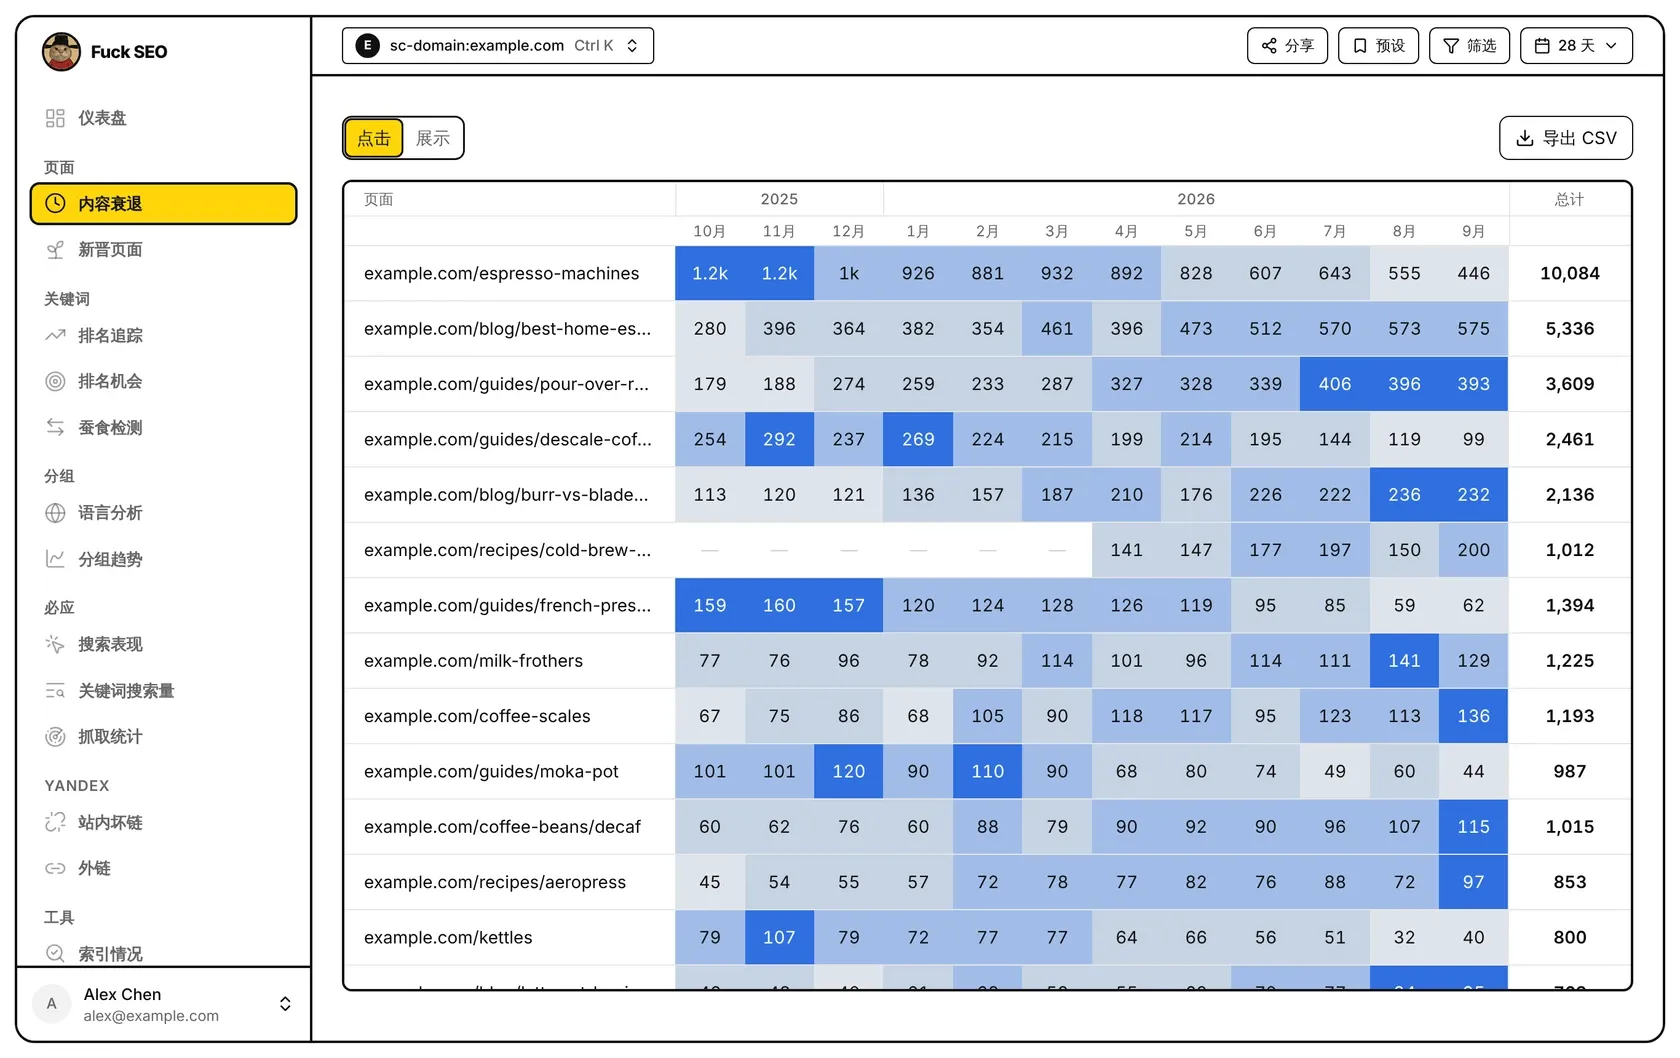
内容衰退页用一张热图显示每个页面在最近 12 个完整月里,点击或展示逐月的变化。每一行是一个页面,每一格是一个自然月,颜色深浅是这个月和该页面自己的月均值相比的结果,方便一次浏览很多页面的逐月走势。
显示哪几个月
表格固定显示 12 个自然月,表头按年份分组。最后一列是最近一个完整月,也就是 GSC 最终数据已经覆盖到月底的那个月。每月最初几天,上个月最后一天的最终数据还没出来,表格仍然停在再往前一个月。
顶部选择的日期范围不影响这 12 个月,只决定详情面板用哪个周期(见下文)。筛选、预设 里的条件,以及日期菜单里的 搜索类型 会生效。
点击还是展示
用表格上方的 点击 / 展示 切换。格子里的数字、总计 列和导出的 CSV 都跟着所选指标走。点击用蓝色,展示用紫色,和仪表盘曲线的颜色一致。
怎么看格子
- 数字:这个页面当月的点击数或展示数。1,000 及以上会缩写(1.5k、69k、1.2M),鼠标移到格子上可以看到准确数字。
- 颜色:每一格和这个页面的月均值相比。月均值从页面第一次有展示的那个月算起,取有数据的月份的平均值。颜色由浅到深分 6 档:不到月均值的 0.4 倍、0.4 至 0.7 倍、0.7 至 1 倍、1 至 1.3 倍、1.3 至 2 倍、2 倍及以上。每一行只和自己比,所以小页面最深的格子和大页面最深的格子都表示”对这个页面来说偏高”,不代表数字一样。
- 空白格:真实的 0。这个页面之前的月份已经有过展示,但这个月没有点击(在展示视图里则是没有展示)。
- ”—“:这个页面当时还没有展示。页面第一次有展示的那个月之前,每一格都显示 ”—“(悬停提示”这个月还没有展示”)。即使在点击视图里,第一个月也按展示来判断,所以有展示、暂时没有点击的月份不会被显示成一串 0。
列出哪些页面
页面按 总计(12 个月之和)从高到低排列,这个顺序不能更改;往下滚动时每次多加载 50 行。总计 列不着色,12 个月都没有展示的页面显示 ”—”。
如果这个站点在 GSC 里提交了 sitemap,列表会以 sitemap 里的网址为准:有数据但不在任何 sitemap 里的页面不显示;sitemap 里有、但 12 个月都没有展示的网址会排在最后,整行显示 ”—“。站点同时有主 sitemap 时,/fr/、/de/ 这类语言目录下的 sitemap 不会被采用。没有 sitemap,或 sitemap 都读取不到时,列出所有有数据的页面。
网域资源可能包含多个子域名,所以页面带域名显示;网址前缀资源只显示路径。
如果某个月有数据的页面超过 10 万个,这个月只加载点击最多的前 10 万个页面。该月表头会带一个 *,表格上方也会出现提示:这些月份里显示为 0 的页面,可能只是没排进前 10 万。
打开页面详情
点一行打开这个页面的详情面板。面板用的是顶部选择的日期范围,不是这 12 个月:点击、展示、排名和 CTR 及其相对上一周期的变化,按天的趋势图(默认显示你在内容衰退页选的指标),这个页面的笔记,以及它排名的查询词。面板里还有 检查收录(打开 索引情况 并填入这个网址)、记一条笔记 和 打开页面。
导出
导出 CSV 会下载列表里的全部页面,包括还没滚动到的行:完整网址、每月一列(YYYY-MM)和总计,数值为所选指标。页面第一次有展示之前的月份导出为 0。手机上不显示这个按钮。